Descriptive Statistics

import os
import seaborn as sns
import plotly.express as px
import pandas as pd
import matplotlib.pyplot as plt
import numpy as np
import plotly.io as pio
from matplotlib.gridspec import GridSpec
import matplotlib.patches as mpatches
from tabulate import tabulate

from hbn.constants import Defaults
from hbn.visualization import visualize as vis

%load_ext autoreload
%autoreload 2

import warnings
warnings.filterwarnings('ignore')
The autoreload extension is already loaded. To reload it, use:
  %reload_ext autoreload
## GET DATA

from hbn.data import make_dataset

# HARDCODE PARTICIPANTS + FEATURE_SPEC
participants = make_dataset.get_participants(
                            split='all', 
                            disorders=['ADHD-Combined_Type', 
                                        'ADHD-Inattentive_Type', 
                                        'ADHD-Hyperactive_Impulsive_Type', 
                                        'Other_Specified_Attention-Deficit_Hyperactivity_Disorder',
                                        'No_Diagnosis_Given']
                                        )

# get summary of clinical diagnosis + other demographics
df_all = make_dataset.make_summary(save=False)
df_all['Age'] = df_all['Age'].round()
#df_all = make_dataset._add_race_ethnicity(dataframe=df_all)
df_CGAS = make_dataset.add_CGAS_Score(df_all)

# get participants
df_part = pd.DataFrame(participants, columns=['Identifiers'])

# filter large dataframe to include only ADHD + No Diagnosis
df = df_all.merge(df_part, on='Identifiers')
df_CGAS = df_CGAS.merge(df_part, on='Identifiers')
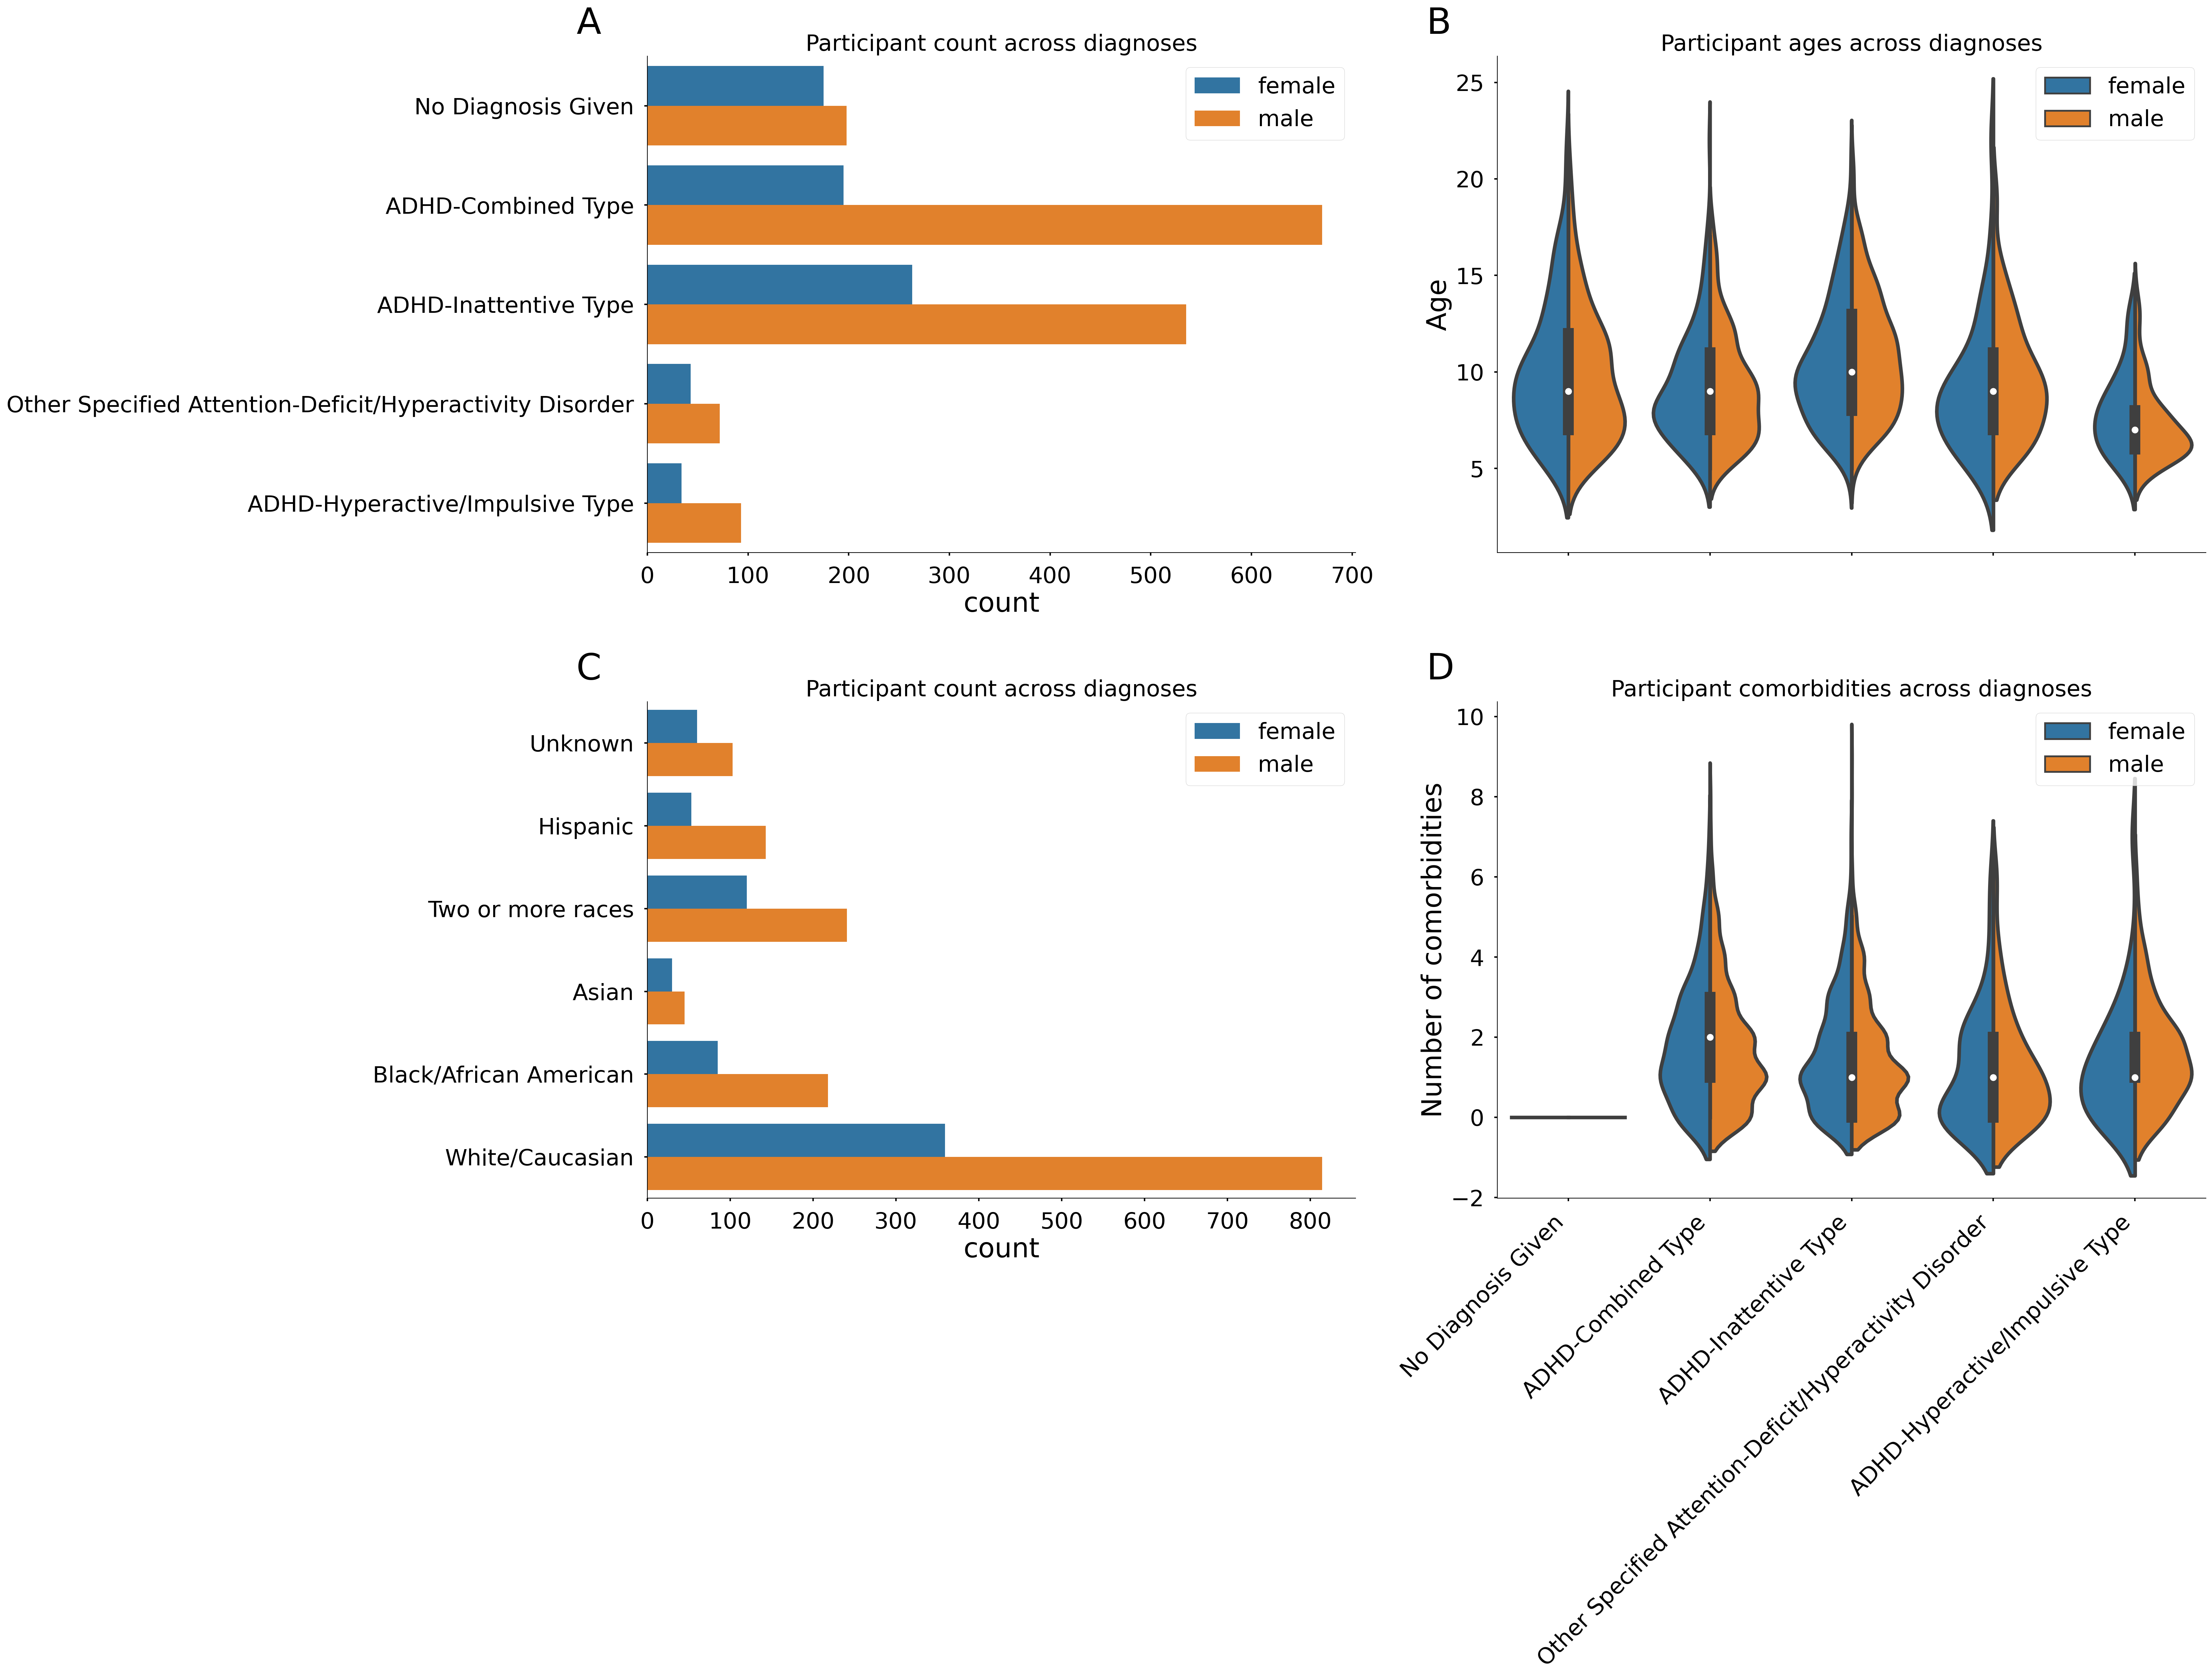
## summary stats

sample_size = len(df_all['Identifiers'].unique())
print(f'total sample size of healthy brain network dataset is {sample_size}\n')

num_ADHD = len(df[df['DX_01_Cat_new']=='ADHD'])
num_no_diagnosis = len(df[df['DX_01_Cat_new']=='No Diagnosis Given'])
print(f'there are {num_ADHD} participants with ADHD and {num_no_diagnosis} with No Diagnosis\n')

# print out summaries
for diagnosis in ['ADHD', 'No Diagnosis Given']:
    print(f'PARTICIPANTS WITH {diagnosis}')
    
    tmp = df[df['DX_01_Cat_new']==diagnosis]
    
    sex = tmp['Sex'].value_counts()
    print(f'1. there are {sex.male} males and {sex.female} females\n')

    ages_6_10 = len(tmp[tmp['Age'].round()<=10])
    ages_10_21 = len(tmp[tmp['Age'].round()>10])
    print(f'2. there are {ages_6_10} children ages 6-10 and {ages_10_21} children ages 11-21\n')

    num_sites = len(tmp['Site'].unique())
    sites = tmp['Site'].value_counts()
    site_numbers = sites.index.tolist()
    site_count = sites.tolist()
    print(f'3. there are {num_sites} study sites and following # of participants collected across the following sites are {site_count}: {site_numbers}\n')

    years = tmp['Enroll_Year'].value_counts().index.astype(str).str.strip('.0').astype(int).tolist()
    num_years = len(tmp['Enroll_Year'].unique())
    print(f'4. data were collected across {num_years} years: {years}\n')

    num_subtypes = len(tmp['DX_01'].unique())
    subtypes = tmp['DX_01'].unique()
    print(f'5. there are {num_subtypes} unique subtypes: {subtypes}\n')

    comorbid = round((tmp['comorbidities'].value_counts() / len(tmp)) * 100)
    num_comorbid = comorbid[1:].sum()
    print(f'6. approximately {num_comorbid}% have disorder combordities\n')

    disorder_cat = round((tmp['DX_01'].value_counts() / len(tmp)) * 100).head(1)
    print(f'7. most prevalent subtype is {disorder_cat.index[0]} - {disorder_cat.values[0]}% of sample\n')

    disorder = round((tmp['DX_01_Cat_new'].value_counts() / len(tmp)) * 100).head(1)
    print(f'8. most prevalent category of diagnosis is {disorder.index[0]} - {disorder.values[0]}% of sample\n')

    tmp_CGAS = df_CGAS[df_CGAS['DX_01_Cat_new']==diagnosis]
    
    sex = tmp_CGAS.groupby(['Sex']).agg({'CGAS_Score': 'mean'})
    f_cgas = sex.loc['male'].values[0]
    m_cgas = sex.loc['female'].values[0]
    print(f'9. females have an average general functioning score (CGAS) of {round(f_cgas)}% and males {round(m_cgas)}%\n')
total sample size of healthy brain network dataset is 4767

there are 1905 participants with ADHD and 373 with No Diagnosis

PARTICIPANTS WITH ADHD
1. there are 1370 males and 535 females

2. there are 1235 children ages 6-10 and 670 children ages 11-21

3. there are 5 study sites and following # of participants collected across the following sites are [842, 537, 471, 42, 13]: [1, 4, 3, 5, 2]

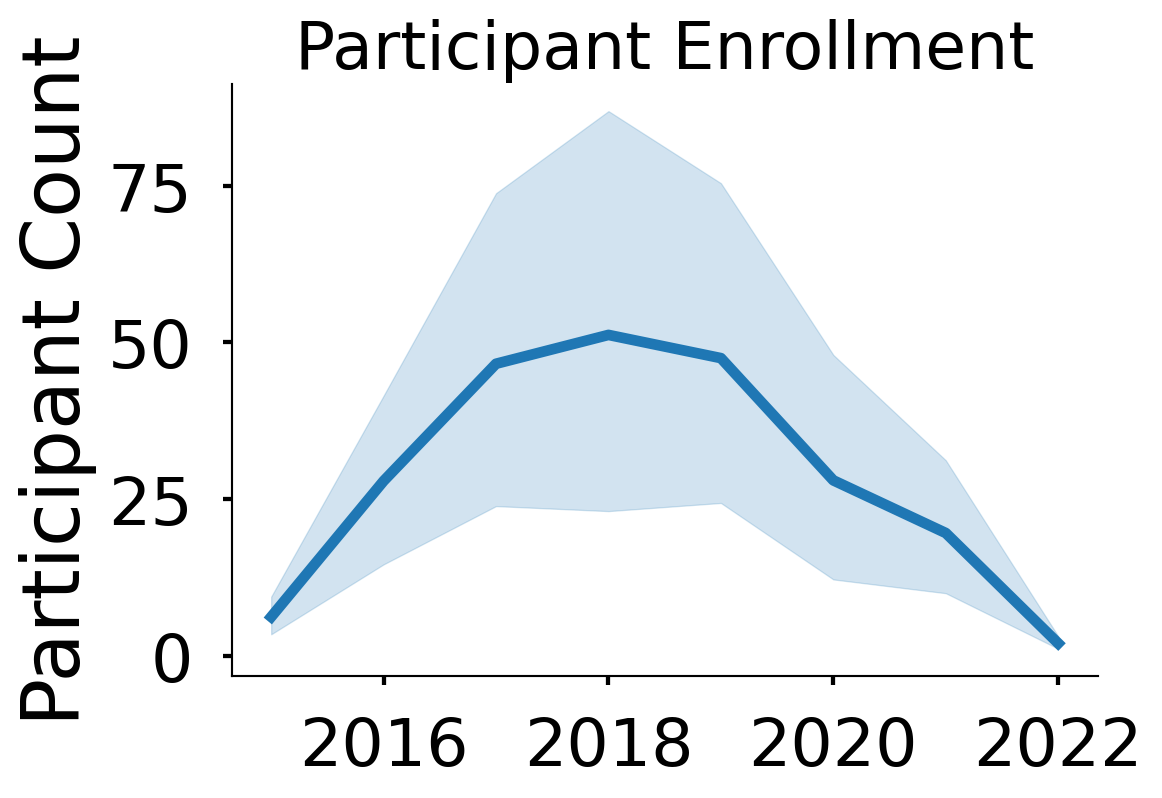
4. data were collected across 8 years: [2018, 2019, 2017, 202, 2016, 2021, 2015, 2022]

5. there are 4 unique subtypes: ['ADHD-Combined Type' 'ADHD-Inattentive Type'
 'Other Specified Attention-Deficit/Hyperactivity Disorder'
 'ADHD-Hyperactive/Impulsive Type']

6. approximately 69.0% have disorder combordities

7. most prevalent subtype is ADHD-Combined Type - 45.0% of sample

8. most prevalent category of diagnosis is ADHD - 100.0% of sample

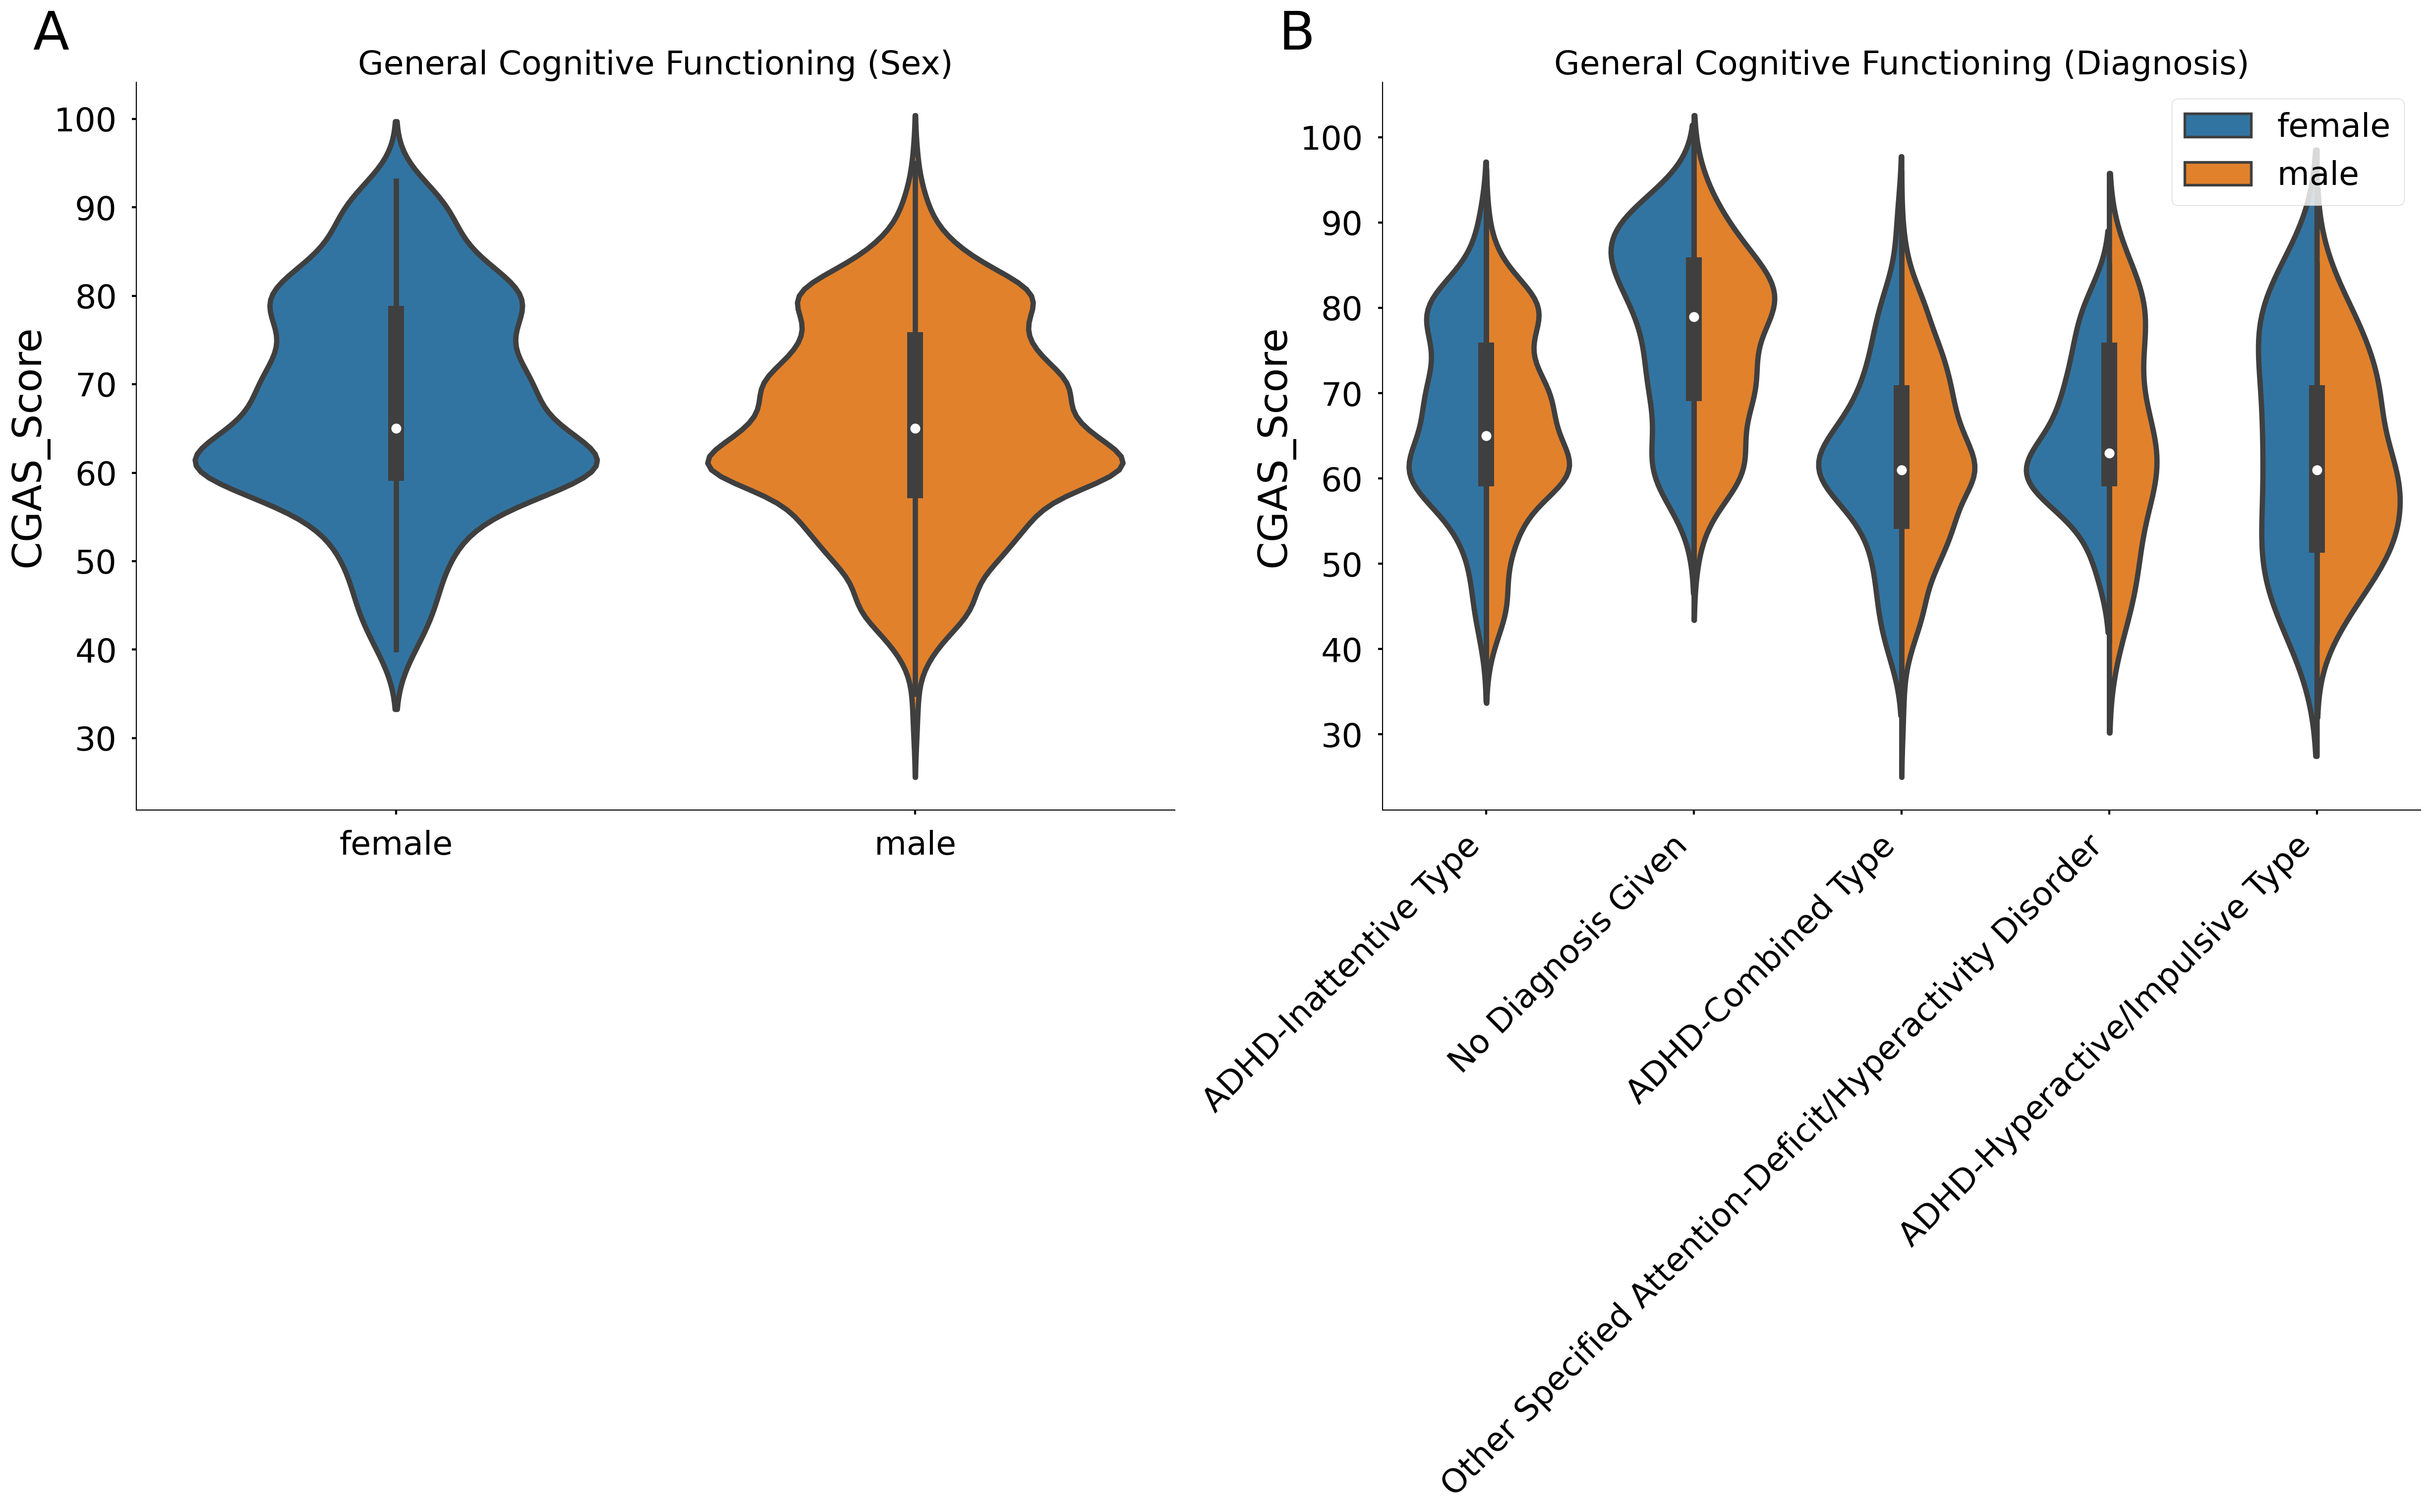
9. females have an average general functioning score (CGAS) of 64% and males 65%

PARTICIPANTS WITH No Diagnosis Given
1. there are 198 males and 175 females

2. there are 229 children ages 6-10 and 144 children ages 11-21

3. there are 5 study sites and following # of participants collected across the following sites are [223, 75, 68, 4, 3]: [1, 3, 4, 2, 5]

4. data were collected across 8 years: [2017, 2016, 2019, 2018, 202, 2021, 2015, 2022]

5. there are 1 unique subtypes: ['No Diagnosis Given']

6. approximately 0.0% have disorder combordities

7. most prevalent subtype is No Diagnosis Given - 100.0% of sample

8. most prevalent category of diagnosis is No Diagnosis Given - 100.0% of sample

9. females have an average general functioning score (CGAS) of 75% and males 78%
plt.clf()
vis.plotting_style()
x_pos = -0.1
y_pos = 1.1
labelsize = 40

fig = plt.figure()
gs = GridSpec(2, 2, figure=fig)

ax = fig.add_subplot(gs[0,0])
ax = sns.countplot(data=df, y='DX_01', hue='Sex', ax=ax)
ax.set_ylabel('')
ax.set_title('Participant count across diagnoses')
ax.text(x_pos, y_pos, 'A', transform=ax.transAxes, fontsize=labelsize, verticalalignment='top')
ax.legend_.set_title(None)

ax = fig.add_subplot(gs[0,1])
ax = sns.violinplot(x='DX_01', y='Age', hue='Sex', split=True, data=df, ax=ax)
plt.xticks(rotation=45, ha='right');
ax.set_xticklabels('')
ax.set_xlabel('')
ax.set_title('Participant ages across diagnoses')
ax.text(x_pos, y_pos, 'B', transform=ax.transAxes, fontsize=labelsize, verticalalignment='top')
ax.legend_.set_title(None)

ax = fig.add_subplot(gs[1,0])
tmp = df[df['PreInt_Demos_Fam,Child_Race_cat'].isin(['Unknown', 'Hispanic', 'Two or more races', 'Asian',
       'Black/African American', 'White/Caucasian'])]
ax = sns.countplot(data=tmp, y='PreInt_Demos_Fam,Child_Race_cat', hue='Sex', ax=ax)
ax.set_ylabel('')
ax.set_title('Participant count across diagnoses')
ax.text(x_pos, y_pos, 'C', transform=ax.transAxes, fontsize=labelsize, verticalalignment='top')
ax.legend_.set_title(None)


ax = fig.add_subplot(gs[1,1])
ax = sns.violinplot(x='DX_01', y='comorbidities', hue='Sex', split=True, data=df, ax=ax)
plt.xticks(rotation=45, ha='right');
ax.set_ylabel('Number of comorbidities')
ax.set_xlabel('')
ax.set_title('Participant comorbidities across diagnoses')
ax.text(x_pos, y_pos, 'D', transform=ax.transAxes, fontsize=labelsize, verticalalignment='top')
ax.legend_.set_title(None)

plt.subplots_adjust(left=0.125, bottom=0.001, right=2.0, top=2.0, wspace=.2, hspace=.3)

#save_path = os.path.join(dirs.figure, f'fig1.svg')
#plt.savefig(save_path, bbox_inches="tight", dpi=300)
<Figure size 672x480 with 0 Axes>

Participant Count

tmp = df.groupby(
    ['DX_01', 'Sex']).count()[['Identifiers']].reset_index().rename(
    {'Identifiers': 'Participant Count'}, axis=1)

head = ['Diagnosis', 'Sex', '# of Participants']
print(tabulate(np.array(tmp), headers=head, tablefmt="grid"))
+----------------------------------------------------------+--------+---------------------+
| Diagnosis                                                | Sex    |   # of Participants |
+==========================================================+========+=====================+
| ADHD-Combined Type                                       | female |                 195 |
+----------------------------------------------------------+--------+---------------------+
| ADHD-Combined Type                                       | male   |                 670 |
+----------------------------------------------------------+--------+---------------------+
| ADHD-Hyperactive/Impulsive Type                          | female |                  34 |
+----------------------------------------------------------+--------+---------------------+
| ADHD-Hyperactive/Impulsive Type                          | male   |                  93 |
+----------------------------------------------------------+--------+---------------------+
| ADHD-Inattentive Type                                    | female |                 263 |
+----------------------------------------------------------+--------+---------------------+
| ADHD-Inattentive Type                                    | male   |                 535 |
+----------------------------------------------------------+--------+---------------------+
| No Diagnosis Given                                       | female |                 175 |
+----------------------------------------------------------+--------+---------------------+
| No Diagnosis Given                                       | male   |                 198 |
+----------------------------------------------------------+--------+---------------------+
| Other Specified Attention-Deficit/Hyperactivity Disorder | female |                  43 |
+----------------------------------------------------------+--------+---------------------+
| Other Specified Attention-Deficit/Hyperactivity Disorder | male   |                  72 |
+----------------------------------------------------------+--------+---------------------+

Age

tmp = df.groupby(
    ['DX_01', 'Sex'])['Age'].agg(
    {'mean', 'std'}).reset_index().rename(
    {'mean': 'mean (age)', 'std': 'std (age)'}, axis=1)

head = tmp.columns.tolist()
print(tabulate(np.array(tmp), headers=head, tablefmt="grid"))
+----------------------------------------------------------+--------+--------------+-------------+
| DX_01                                                    | Sex    |   mean (age) |   std (age) |
+==========================================================+========+==============+=============+
| ADHD-Combined Type                                       | female |      9.22051 |     2.857   |
+----------------------------------------------------------+--------+--------------+-------------+
| ADHD-Combined Type                                       | male   |      9.24627 |     2.88814 |
+----------------------------------------------------------+--------+--------------+-------------+
| ADHD-Hyperactive/Impulsive Type                          | female |      7.94118 |     2.14534 |
+----------------------------------------------------------+--------+--------------+-------------+
| ADHD-Hyperactive/Impulsive Type                          | male   |      7.33333 |     2.01264 |
+----------------------------------------------------------+--------+--------------+-------------+
| ADHD-Inattentive Type                                    | female |     10.4601  |     3.10462 |
+----------------------------------------------------------+--------+--------------+-------------+
| ADHD-Inattentive Type                                    | male   |     10.8879  |     3.14544 |
+----------------------------------------------------------+--------+--------------+-------------+
| No Diagnosis Given                                       | female |     10.0971  |     3.57301 |
+----------------------------------------------------------+--------+--------------+-------------+
| No Diagnosis Given                                       | male   |      9.76768 |     3.40447 |
+----------------------------------------------------------+--------+--------------+-------------+
| Other Specified Attention-Deficit/Hyperactivity Disorder | female |      9.13953 |     3.38471 |
+----------------------------------------------------------+--------+--------------+-------------+
| Other Specified Attention-Deficit/Hyperactivity Disorder | male   |      9.70833 |     3.09674 |
+----------------------------------------------------------+--------+--------------+-------------+

Race/Ethnicity

tmp = df[df['PreInt_Demos_Fam,Child_Race_cat'].isin(['Unknown', 'Hispanic', 'Two or more races', 'Asian',
       'Black/African American', 'White/Caucasian'])]


tmp = df.groupby(
    ['PreInt_Demos_Fam,Child_Race_cat', 'Sex']).count()[['Identifiers']].reset_index().rename(
    {'Identifiers': 'Participant Count'}, axis=1)

head = ['Race/Ethnicity', 'Sex', '# of Participants']
print(tabulate(np.array(tmp), headers=head, tablefmt="grid"))
+----------------------------------------+--------+---------------------+
| Race/Ethnicity                         | Sex    |   # of Participants |
+========================================+========+=====================+
| Asian                                  | female |                  30 |
+----------------------------------------+--------+---------------------+
| Asian                                  | male   |                  45 |
+----------------------------------------+--------+---------------------+
| Black/African American                 | female |                  85 |
+----------------------------------------+--------+---------------------+
| Black/African American                 | male   |                 218 |
+----------------------------------------+--------+---------------------+
| Hispanic                               | female |                  53 |
+----------------------------------------+--------+---------------------+
| Hispanic                               | male   |                 143 |
+----------------------------------------+--------+---------------------+
| Native American                        | female |                   2 |
+----------------------------------------+--------+---------------------+
| Native American                        | male   |                   3 |
+----------------------------------------+--------+---------------------+
| Native Hawaiian/Other Pacific Islander | female |                   1 |
+----------------------------------------+--------+---------------------+
| Native Hawaiian/Other Pacific Islander | male   |                   1 |
+----------------------------------------+--------+---------------------+
| Two or more races                      | female |                 120 |
+----------------------------------------+--------+---------------------+
| Two or more races                      | male   |                 241 |
+----------------------------------------+--------+---------------------+
| Unknown                                | female |                  60 |
+----------------------------------------+--------+---------------------+
| Unknown                                | male   |                 103 |
+----------------------------------------+--------+---------------------+
| White/Caucasian                        | female |                 359 |
+----------------------------------------+--------+---------------------+
| White/Caucasian                        | male   |                 814 |
+----------------------------------------+--------+---------------------+

Comorbidities

tmp = df.groupby(
    ['DX_01', 'Sex'])['comorbidities'].agg(
    {'mean', 'std'}).reset_index().rename(
    {'mean': 'mean (comorbidities)', 'std': 'std (comorbidities)'}, axis=1)

head = tmp.columns.tolist()
print(tabulate(np.array(tmp), headers=head, tablefmt="grid"))
+----------------------------------------------------------+--------+------------------------+-----------------------+
| DX_01                                                    | Sex    |   mean (comorbidities) |   std (comorbidities) |
+==========================================================+========+========================+=======================+
| ADHD-Combined Type                                       | female |                1.84615 |               1.49808 |
+----------------------------------------------------------+--------+------------------------+-----------------------+
| ADHD-Combined Type                                       | male   |                1.79104 |               1.54492 |
+----------------------------------------------------------+--------+------------------------+-----------------------+
| ADHD-Hyperactive/Impulsive Type                          | female |                1.32353 |               1.47135 |
+----------------------------------------------------------+--------+------------------------+-----------------------+
| ADHD-Hyperactive/Impulsive Type                          | male   |                1.62366 |               1.30978 |
+----------------------------------------------------------+--------+------------------------+-----------------------+
| ADHD-Inattentive Type                                    | female |                1.57034 |               1.40127 |
+----------------------------------------------------------+--------+------------------------+-----------------------+
| ADHD-Inattentive Type                                    | male   |                1.48411 |               1.41396 |
+----------------------------------------------------------+--------+------------------------+-----------------------+
| No Diagnosis Given                                       | female |                0       |               0       |
+----------------------------------------------------------+--------+------------------------+-----------------------+
| No Diagnosis Given                                       | male   |                0       |               0       |
+----------------------------------------------------------+--------+------------------------+-----------------------+
| Other Specified Attention-Deficit/Hyperactivity Disorder | female |                1.18605 |               1.48414 |
+----------------------------------------------------------+--------+------------------------+-----------------------+
| Other Specified Attention-Deficit/Hyperactivity Disorder | male   |                1.26389 |               1.45344 |
+----------------------------------------------------------+--------+------------------------+-----------------------+

CGAS Score (General Cognitive Functioning)

plt.clf()
vis.plotting_style()
x_pos = -0.1
y_pos = 1.1
labelsize = 40

fig = plt.figure()
gs = GridSpec(2, 2, figure=fig)

ax = fig.add_subplot(gs[0,0])
ax = sns.violinplot(data=df_CGAS, x='Sex', y='CGAS_Score', ax=ax)
ax.set_xlabel('')
ax.set_title('General Cognitive Functioning (Sex)')
ax.text(x_pos, y_pos, 'A', transform=ax.transAxes, fontsize=labelsize, verticalalignment='top')

ax = fig.add_subplot(gs[0,1])
ax = sns.violinplot(data=df_CGAS, x='DX_01', y='CGAS_Score', hue='Sex', split=True, ax=ax)
plt.xticks(rotation=45, ha='right');
ax.set_xlabel('')
ax.set_title('General Cognitive Functioning (Diagnosis)')
ax.text(x_pos, y_pos, 'B', transform=ax.transAxes, fontsize=labelsize, verticalalignment='top')
ax.legend_.set_title(None)

plt.subplots_adjust(left=0.125, bottom=0.001, right=2.0, top=2.0, wspace=.2, hspace=.3)
<Figure size 1228.8x844.8 with 0 Axes>

tmp = df_CGAS.groupby(
    ['DX_01', 'Sex'])['CGAS_Score'].agg(
    {'mean', 'std'}).reset_index().rename(
    {'mean': 'mean (CGAS)', 'std': 'std (CGAS)'}, axis=1)

head = tmp.columns.tolist()
print(tabulate(np.array(tmp), headers=head, tablefmt="grid"))
+----------------------------------------------------------+--------+---------------+--------------+
| DX_01                                                    | Sex    |   mean (CGAS) |   std (CGAS) |
+==========================================================+========+===============+==============+
| ADHD-Combined Type                                       | female |       62.3455 |     10.7984  |
+----------------------------------------------------------+--------+---------------+--------------+
| ADHD-Combined Type                                       | male   |       62.2609 |     10.7143  |
+----------------------------------------------------------+--------+---------------+--------------+
| ADHD-Hyperactive/Impulsive Type                          | female |       63.8667 |     13.3745  |
+----------------------------------------------------------+--------+---------------+--------------+
| ADHD-Hyperactive/Impulsive Type                          | male   |       61.8875 |     10.8406  |
+----------------------------------------------------------+--------+---------------+--------------+
| ADHD-Inattentive Type                                    | female |       67.4135 |     10.6611  |
+----------------------------------------------------------+--------+---------------+--------------+
| ADHD-Inattentive Type                                    | male   |       65.7895 |     10.8259  |
+----------------------------------------------------------+--------+---------------+--------------+
| No Diagnosis Given                                       | female |       77.844  |     10.8279  |
+----------------------------------------------------------+--------+---------------+--------------+
| No Diagnosis Given                                       | male   |       74.8832 |     10.162   |
+----------------------------------------------------------+--------+---------------+--------------+
| Other Specified Attention-Deficit/Hyperactivity Disorder | female |       65.0286 |      8.20146 |
+----------------------------------------------------------+--------+---------------+--------------+
| Other Specified Attention-Deficit/Hyperactivity Disorder | male   |       64.5833 |     12.2603  |
+----------------------------------------------------------+--------+---------------+--------------+

Year of Enrollment

plt.clf()
vis.plotting_style()
x_pos = -0.1
y_pos = 1.1
labelsize = 40

fig = plt.figure()
gs = GridSpec(2, 2, figure=fig)

tmp = df.groupby(
    ['Enroll_Year', 'DX_01', 'Sex']).count()[['Identifiers']].reset_index().rename(
    {'Identifiers': 'Participant Count'}, axis=1)

ax = fig.add_subplot(gs[0,0])
ax = sns.lineplot(data=tmp, x='Enroll_Year', y='Participant Count', ax=ax)
ax.set_xlabel('')
ax.set_title('Participant Enrollment');
<Figure size 1228.8x844.8 with 0 Axes>

tmp = df.groupby(
    ['Enroll_Year', 'DX_01', 'Sex']).count()[['Identifiers']].reset_index().rename(
    {'Identifiers': 'Participant Count'}, axis=1)

head = ['Enrollment Year', 'Diagnosis', 'Sex', '# of Participants']
print(tabulate(np.array(tmp), headers=head, tablefmt="grid"))
+-------------------+----------------------------------------------------------+--------+---------------------+
|   Enrollment Year | Diagnosis                                                | Sex    |   # of Participants |
+===================+==========================================================+========+=====================+
|              2015 | ADHD-Combined Type                                       | female |                   4 |
+-------------------+----------------------------------------------------------+--------+---------------------+
|              2015 | ADHD-Combined Type                                       | male   |                  15 |
+-------------------+----------------------------------------------------------+--------+---------------------+
|              2015 | ADHD-Hyperactive/Impulsive Type                          | male   |                   1 |
+-------------------+----------------------------------------------------------+--------+---------------------+
|              2015 | ADHD-Inattentive Type                                    | female |                   5 |
+-------------------+----------------------------------------------------------+--------+---------------------+
|              2015 | ADHD-Inattentive Type                                    | male   |                   6 |
+-------------------+----------------------------------------------------------+--------+---------------------+
|              2015 | No Diagnosis Given                                       | female |                  12 |
+-------------------+----------------------------------------------------------+--------+---------------------+
|              2015 | No Diagnosis Given                                       | male   |                   9 |
+-------------------+----------------------------------------------------------+--------+---------------------+
|              2015 | Other Specified Attention-Deficit/Hyperactivity Disorder | female |                   1 |
+-------------------+----------------------------------------------------------+--------+---------------------+
|              2015 | Other Specified Attention-Deficit/Hyperactivity Disorder | male   |                   3 |
+-------------------+----------------------------------------------------------+--------+---------------------+
|              2016 | ADHD-Combined Type                                       | female |                  25 |
+-------------------+----------------------------------------------------------+--------+---------------------+
|              2016 | ADHD-Combined Type                                       | male   |                  78 |
+-------------------+----------------------------------------------------------+--------+---------------------+
|              2016 | ADHD-Hyperactive/Impulsive Type                          | female |                   3 |
+-------------------+----------------------------------------------------------+--------+---------------------+
|              2016 | ADHD-Hyperactive/Impulsive Type                          | male   |                  10 |
+-------------------+----------------------------------------------------------+--------+---------------------+
|              2016 | ADHD-Inattentive Type                                    | female |                  16 |
+-------------------+----------------------------------------------------------+--------+---------------------+
|              2016 | ADHD-Inattentive Type                                    | male   |                  38 |
+-------------------+----------------------------------------------------------+--------+---------------------+
|              2016 | No Diagnosis Given                                       | female |                  49 |
+-------------------+----------------------------------------------------------+--------+---------------------+
|              2016 | No Diagnosis Given                                       | male   |                  43 |
+-------------------+----------------------------------------------------------+--------+---------------------+
|              2016 | Other Specified Attention-Deficit/Hyperactivity Disorder | female |                   6 |
+-------------------+----------------------------------------------------------+--------+---------------------+
|              2016 | Other Specified Attention-Deficit/Hyperactivity Disorder | male   |                  11 |
+-------------------+----------------------------------------------------------+--------+---------------------+
|              2017 | ADHD-Combined Type                                       | female |                  35 |
+-------------------+----------------------------------------------------------+--------+---------------------+
|              2017 | ADHD-Combined Type                                       | male   |                 141 |
+-------------------+----------------------------------------------------------+--------+---------------------+
|              2017 | ADHD-Hyperactive/Impulsive Type                          | female |                   7 |
+-------------------+----------------------------------------------------------+--------+---------------------+
|              2017 | ADHD-Hyperactive/Impulsive Type                          | male   |                  20 |
+-------------------+----------------------------------------------------------+--------+---------------------+
|              2017 | ADHD-Inattentive Type                                    | female |                  48 |
+-------------------+----------------------------------------------------------+--------+---------------------+
|              2017 | ADHD-Inattentive Type                                    | male   |                  99 |
+-------------------+----------------------------------------------------------+--------+---------------------+
|              2017 | No Diagnosis Given                                       | female |                  37 |
+-------------------+----------------------------------------------------------+--------+---------------------+
|              2017 | No Diagnosis Given                                       | male   |                  57 |
+-------------------+----------------------------------------------------------+--------+---------------------+
|              2017 | Other Specified Attention-Deficit/Hyperactivity Disorder | female |                   9 |
+-------------------+----------------------------------------------------------+--------+---------------------+
|              2017 | Other Specified Attention-Deficit/Hyperactivity Disorder | male   |                  13 |
+-------------------+----------------------------------------------------------+--------+---------------------+
|              2018 | ADHD-Combined Type                                       | female |                  47 |
+-------------------+----------------------------------------------------------+--------+---------------------+
|              2018 | ADHD-Combined Type                                       | male   |                 153 |
+-------------------+----------------------------------------------------------+--------+---------------------+
|              2018 | ADHD-Hyperactive/Impulsive Type                          | female |                   8 |
+-------------------+----------------------------------------------------------+--------+---------------------+
|              2018 | ADHD-Hyperactive/Impulsive Type                          | male   |                  10 |
+-------------------+----------------------------------------------------------+--------+---------------------+
|              2018 | ADHD-Inattentive Type                                    | female |                  68 |
+-------------------+----------------------------------------------------------+--------+---------------------+
|              2018 | ADHD-Inattentive Type                                    | male   |                 145 |
+-------------------+----------------------------------------------------------+--------+---------------------+
|              2018 | No Diagnosis Given                                       | female |                  29 |
+-------------------+----------------------------------------------------------+--------+---------------------+
|              2018 | No Diagnosis Given                                       | male   |                  25 |
+-------------------+----------------------------------------------------------+--------+---------------------+
|              2018 | Other Specified Attention-Deficit/Hyperactivity Disorder | female |                  10 |
+-------------------+----------------------------------------------------------+--------+---------------------+
|              2018 | Other Specified Attention-Deficit/Hyperactivity Disorder | male   |                  17 |
+-------------------+----------------------------------------------------------+--------+---------------------+
|              2019 | ADHD-Combined Type                                       | female |                  43 |
+-------------------+----------------------------------------------------------+--------+---------------------+
|              2019 | ADHD-Combined Type                                       | male   |                 139 |
+-------------------+----------------------------------------------------------+--------+---------------------+
|              2019 | ADHD-Hyperactive/Impulsive Type                          | female |                   9 |
+-------------------+----------------------------------------------------------+--------+---------------------+
|              2019 | ADHD-Hyperactive/Impulsive Type                          | male   |                  26 |
+-------------------+----------------------------------------------------------+--------+---------------------+
|              2019 | ADHD-Inattentive Type                                    | female |                  54 |
+-------------------+----------------------------------------------------------+--------+---------------------+
|              2019 | ADHD-Inattentive Type                                    | male   |                 122 |
+-------------------+----------------------------------------------------------+--------+---------------------+
|              2019 | No Diagnosis Given                                       | female |                  25 |
+-------------------+----------------------------------------------------------+--------+---------------------+
|              2019 | No Diagnosis Given                                       | male   |                  30 |
+-------------------+----------------------------------------------------------+--------+---------------------+
|              2019 | Other Specified Attention-Deficit/Hyperactivity Disorder | female |                  12 |
+-------------------+----------------------------------------------------------+--------+---------------------+
|              2019 | Other Specified Attention-Deficit/Hyperactivity Disorder | male   |                  15 |
+-------------------+----------------------------------------------------------+--------+---------------------+
|              2020 | ADHD-Combined Type                                       | female |                  23 |
+-------------------+----------------------------------------------------------+--------+---------------------+
|              2020 | ADHD-Combined Type                                       | male   |                  87 |
+-------------------+----------------------------------------------------------+--------+---------------------+
|              2020 | ADHD-Hyperactive/Impulsive Type                          | female |                   3 |
+-------------------+----------------------------------------------------------+--------+---------------------+
|              2020 | ADHD-Hyperactive/Impulsive Type                          | male   |                  12 |
+-------------------+----------------------------------------------------------+--------+---------------------+
|              2020 | ADHD-Inattentive Type                                    | female |                  41 |
+-------------------+----------------------------------------------------------+--------+---------------------+
|              2020 | ADHD-Inattentive Type                                    | male   |                  73 |
+-------------------+----------------------------------------------------------+--------+---------------------+
|              2020 | No Diagnosis Given                                       | female |                  15 |
+-------------------+----------------------------------------------------------+--------+---------------------+
|              2020 | No Diagnosis Given                                       | male   |                  17 |
+-------------------+----------------------------------------------------------+--------+---------------------+
|              2020 | Other Specified Attention-Deficit/Hyperactivity Disorder | female |                   2 |
+-------------------+----------------------------------------------------------+--------+---------------------+
|              2020 | Other Specified Attention-Deficit/Hyperactivity Disorder | male   |                   7 |
+-------------------+----------------------------------------------------------+--------+---------------------+
|              2021 | ADHD-Combined Type                                       | female |                  18 |
+-------------------+----------------------------------------------------------+--------+---------------------+
|              2021 | ADHD-Combined Type                                       | male   |                  52 |
+-------------------+----------------------------------------------------------+--------+---------------------+
|              2021 | ADHD-Hyperactive/Impulsive Type                          | female |                   3 |
+-------------------+----------------------------------------------------------+--------+---------------------+
|              2021 | ADHD-Hyperactive/Impulsive Type                          | male   |                  12 |
+-------------------+----------------------------------------------------------+--------+---------------------+
|              2021 | ADHD-Inattentive Type                                    | female |                  29 |
+-------------------+----------------------------------------------------------+--------+---------------------+
|              2021 | ADHD-Inattentive Type                                    | male   |                  51 |
+-------------------+----------------------------------------------------------+--------+---------------------+
|              2021 | No Diagnosis Given                                       | female |                   6 |
+-------------------+----------------------------------------------------------+--------+---------------------+
|              2021 | No Diagnosis Given                                       | male   |                  16 |
+-------------------+----------------------------------------------------------+--------+---------------------+
|              2021 | Other Specified Attention-Deficit/Hyperactivity Disorder | female |                   3 |
+-------------------+----------------------------------------------------------+--------+---------------------+
|              2021 | Other Specified Attention-Deficit/Hyperactivity Disorder | male   |                   6 |
+-------------------+----------------------------------------------------------+--------+---------------------+
|              2022 | ADHD-Combined Type                                       | male   |                   5 |
+-------------------+----------------------------------------------------------+--------+---------------------+
|              2022 | ADHD-Hyperactive/Impulsive Type                          | female |                   1 |
+-------------------+----------------------------------------------------------+--------+---------------------+
|              2022 | ADHD-Hyperactive/Impulsive Type                          | male   |                   2 |
+-------------------+----------------------------------------------------------+--------+---------------------+
|              2022 | ADHD-Inattentive Type                                    | female |                   2 |
+-------------------+----------------------------------------------------------+--------+---------------------+
|              2022 | ADHD-Inattentive Type                                    | male   |                   1 |
+-------------------+----------------------------------------------------------+--------+---------------------+
|              2022 | No Diagnosis Given                                       | female |                   2 |
+-------------------+----------------------------------------------------------+--------+---------------------+
|              2022 | No Diagnosis Given                                       | male   |                   1 |
+-------------------+----------------------------------------------------------+--------+---------------------+

Results from Predictive Models

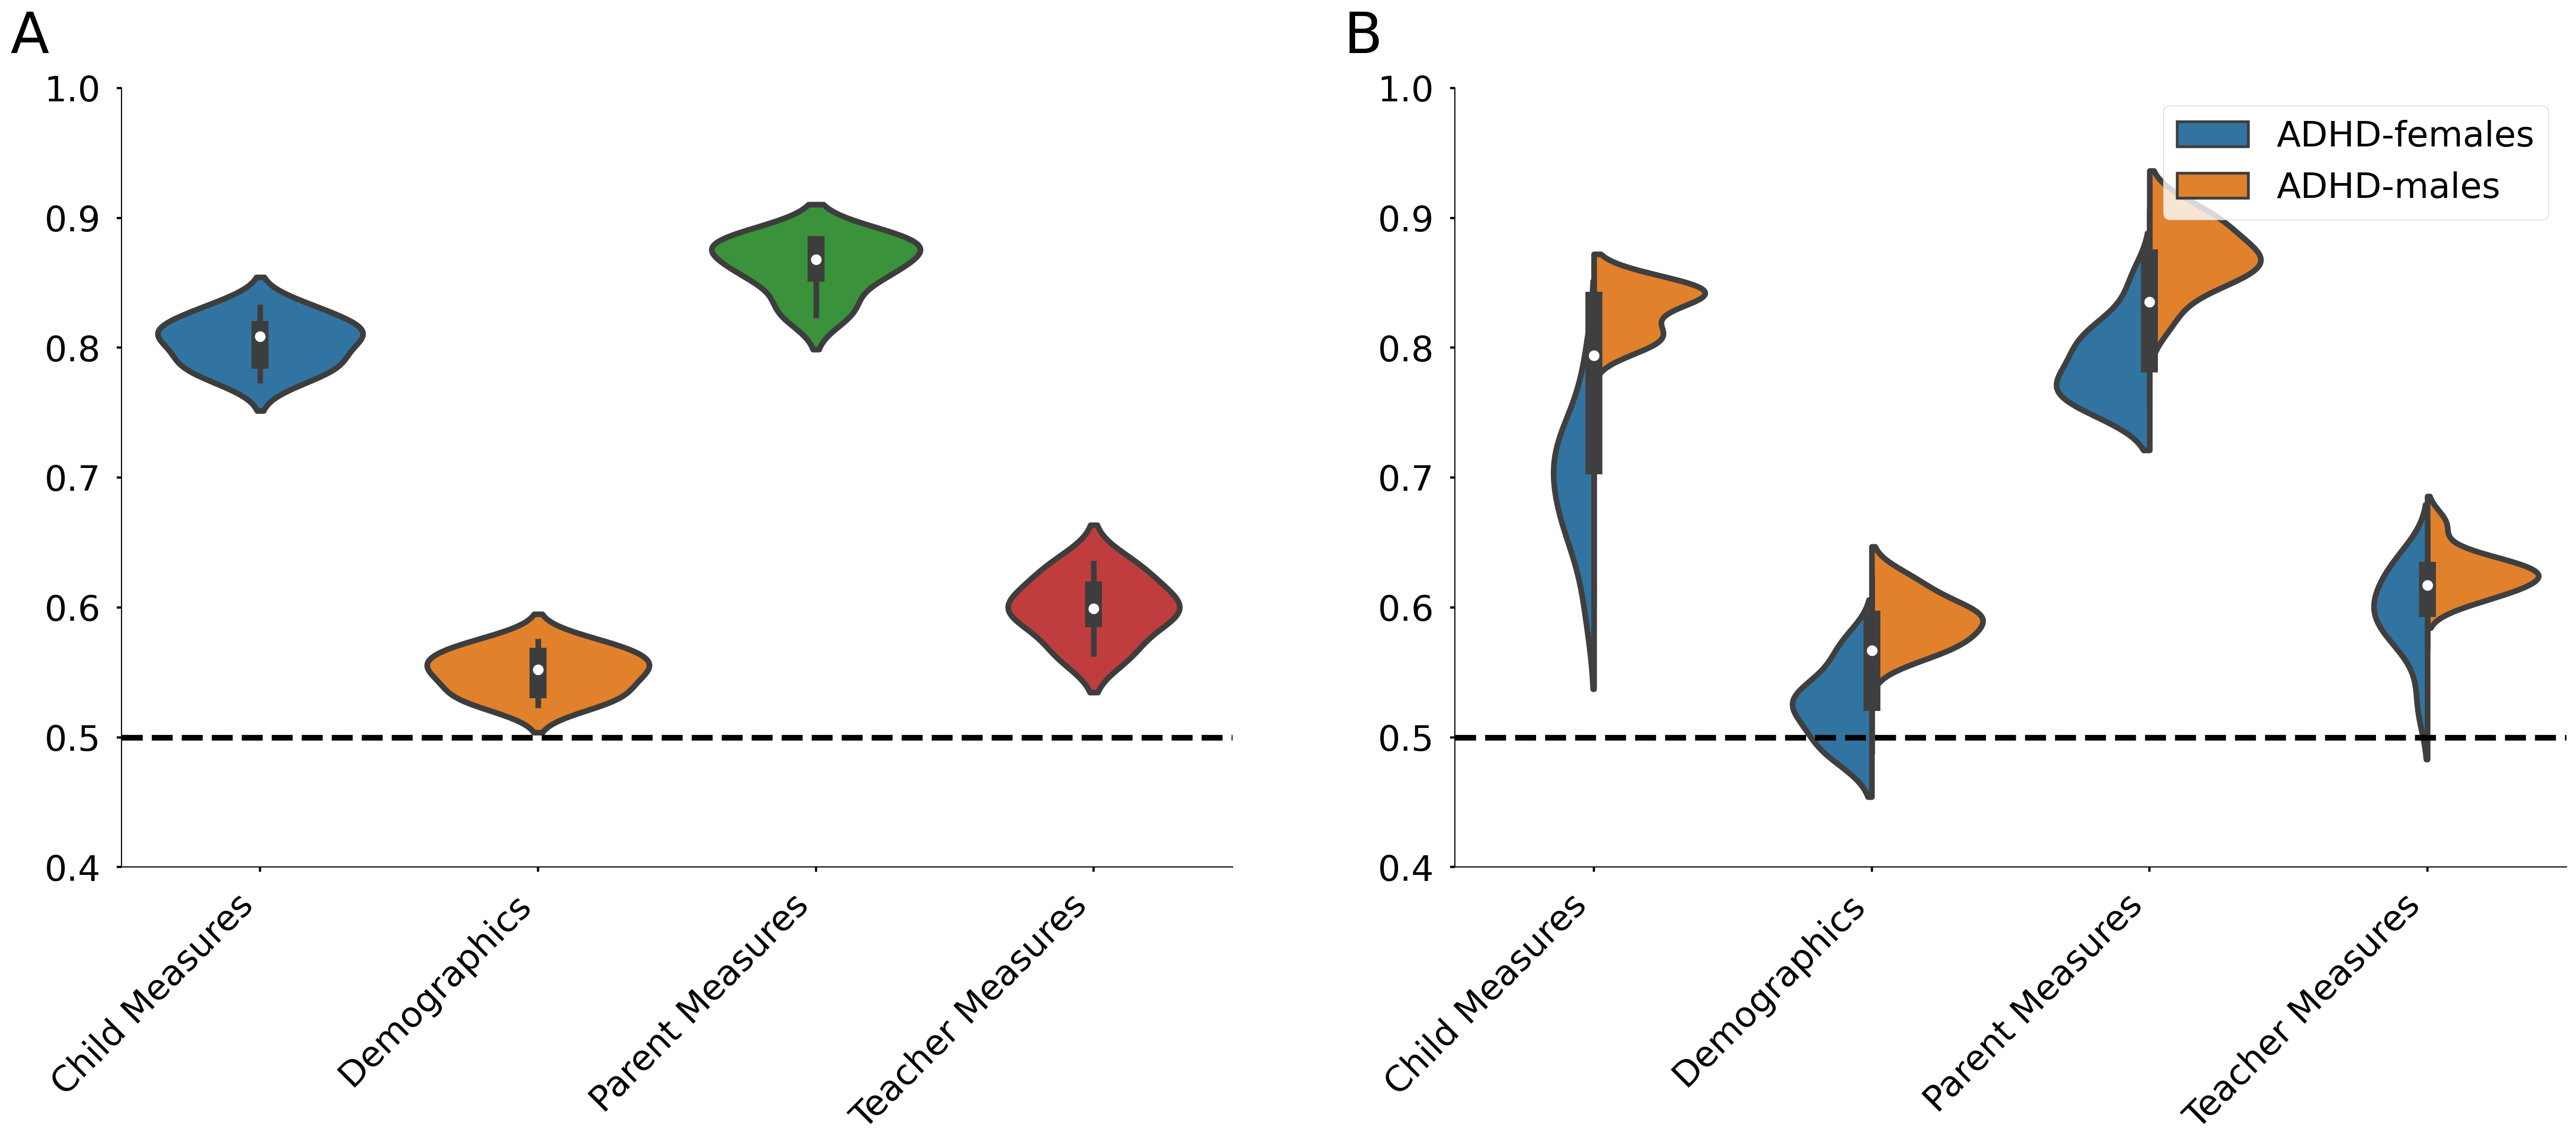
In this section, we’re building models on different sets of features (Child, Parent, Teacher Measures and basic demographics (e.g., race, ethnicity, age, sex) and determining how well these models classify whether or not someone has a diagnosis (versus no diagnosis).

We are building models separately for males and females to identify whether certain features (or all features) classify males better than females (or vice versa)

We have built models on the following diagnoses: ADHD, ASD, Depression, Anxiety, Reading Impairment (our primary interest is ADHD but we can interpret results for ADHD model relative to the other diagnoses)


models_dict = {
                'ADHD': 'all_feature_models/2023-03-17_16-20-51-94',
                'ASD-females': 'all_feature_models/2023-03-19_15-31-26-26S-7',
                'ASD-males': 'all_feature_models/2023-03-22_16-13-13-13S-76',
                'ADHD-females': 'all_feature_models/2023-03-19_15-30-41-41S-99',
                'ADHD-males': 'all_feature_models/2023-03-19_15-30-25-25S-53',
               'Depression-females': 'all_feature_models/2023-03-22_17-43-23-23S-41',
               'Depression-males': 'all_feature_models/2023-03-22_17-43-23-23S-13',
               'Anxiety-females': 'all_feature_models/2023-03-22_17-43-19-19S-66',
               'Anxiety-males': 'all_feature_models/2023-03-22_17-43-14-14S-30',
               'Reading Impairment-females': 'all_feature_models/2023-03-22_17-43-10-10S-35',
               'Reading Impairment-males': 'all_feature_models/2023-03-19_15-31-26-26S-7' 
              }

# loop over models
df_all = pd.DataFrame()
for key, value in models_dict.items():
    MODEL_DIR = os.path.join(Defaults.MODEL_DIR, value)

    df_classify = pd.read_csv(os.path.join(MODEL_DIR, 'classifier-all-phenotypic-models-performance.csv'))
    df_classify['data'] = df_classify['data'].map({'model-data': 'null', 'model-null': 'data'})
    df_classify['participant_group'] = key
    
    df_all = pd.concat([df_all, df_classify])
    
# do some remapping
df_all['features'] = df_all['features'].map({'Child Measures-all': 'Child Measures',
                    'Parent Measures-all': 'Parent Measures',
                    'Teacher Measures-all': 'Teacher Measures',
                    'Parent Measures-Basic_Demos': 'Demographics'}
                   )

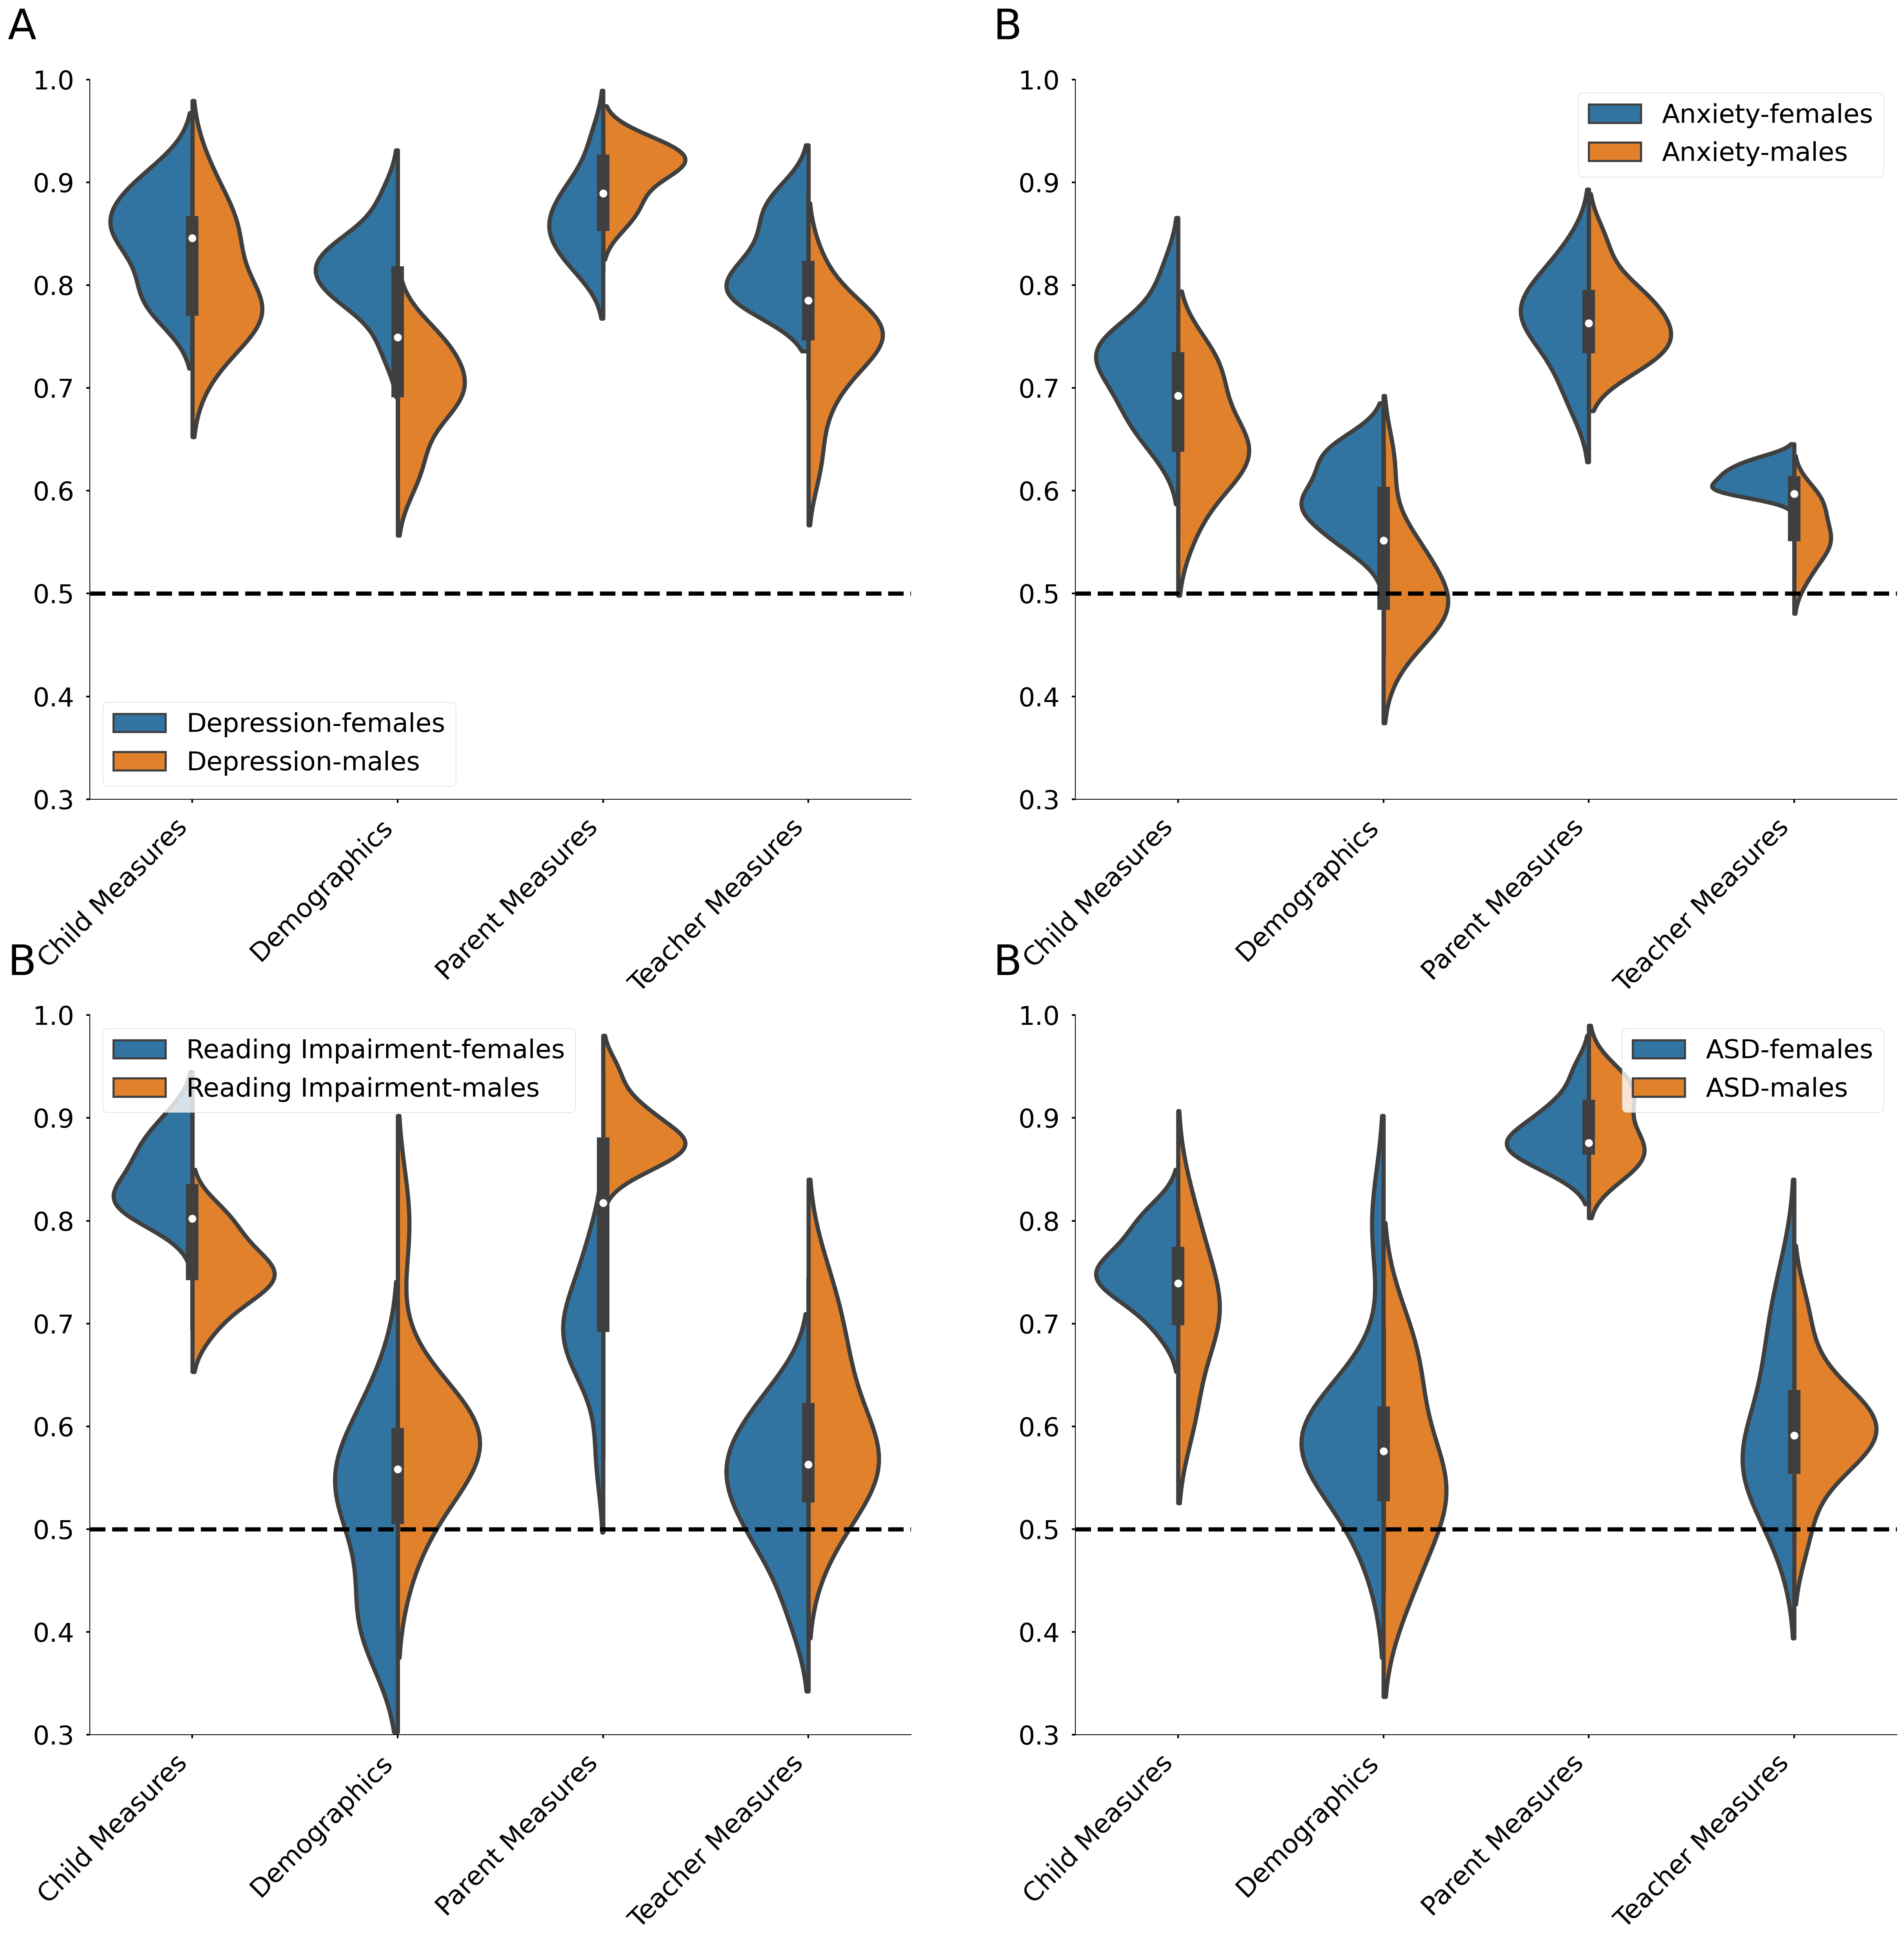
Predictive Modeling - ADHD for Child, Parent, Teacher, Demographics

A result of 50% is chance level (model is not distinguishing between either group) – chance is indicated in the figures with a dashed black line. 100% is a perfect classification.

Interpreting the figure: * A) Parent and Child measures are well above chance (80, 85% respectively) while demographics and Teacher measures are close to chance. In distinguishing whether participants have ADHD or no diagnosis, the parent model does best, followed closely by the child model. * B) When we split by sex, we can see that for each model, the males are better classified than females

plt.clf()
vis.plotting_style()
x_pos = -0.1
y_pos = 1.1
labelsize = 40

fig = plt.figure()
gs = GridSpec(2, 2, figure=fig)

ax = fig.add_subplot(gs[0,0])
df1 = df_all[
    (df_all['participant_group']=='ADHD') & 
    (df_all['target']=='DX_01_Cat_new_binarize') &
    (df_all['data']=='data')
    ]
ax = sns.violinplot(x='features', y='roc_auc_score', data=df1, ax=ax)
plt.xticks(rotation=45, ha='right')
ax.set_xlabel('')
ax.set_ylabel('')
#ax.set_title('')
plt.axhline(y=0.5, color='k', linestyle='--')
ax.text(x_pos, y_pos, 'A', transform=ax.transAxes, fontsize=labelsize, verticalalignment='top')
ax.set_ylim([0.4, 1])

ax = fig.add_subplot(gs[0,1])
df1 = df_all[
    (df_all['participant_group'].str.contains('ADHD-')) & 
    (df_all['target']=='DX_01_Cat_new_binarize') &
    (df_all['data']=='data') 
    ]
ax = sns.violinplot(x='features', y='roc_auc_score', hue='participant_group', split=True, data=df1, ax=ax)
plt.xticks(rotation=45, ha='right')
ax.set_xlabel('')
ax.set_ylabel('')
#ax.set_title('')
plt.axhline(y=0.5, color='k', linestyle='--')
ax.text(x_pos, y_pos, 'B', transform=ax.transAxes, fontsize=labelsize, verticalalignment='top')
ax.legend_.set_title(None)
ax.set_ylim([0.4, 1])

plt.subplots_adjust(left=0.125, bottom=0.001, right=2.0, top=2.0, wspace=.2, hspace=.3)
<Figure size 1228.8x844.8 with 0 Axes>

Predictive Modeling - Depression, ASD, Anxiety, Reading Impairment for Child, Parent, Teacher, Demographics

Interpreting the figure: * A) Models classify depression quite well (around 80%) - demographics and teacher slightly lower. Females are better classified than males for both demographics and teacher measures * B) similar pattern of results for anxiety as depression except that scores are sig. lower * C) demographic and teacher models are close to chance for reading impairment (and no sig. male/female differences). For parent and child measures, the classifier predicts pretty well (about 80%) and there is a dissociation between males and females across these measures. Males are far better classified than females by the parent model and vice versa for the child model. * D) For the ASD group, there are no classification differences between males and females, parent model sig. outperforms child, teacher, demographics at 90% accuracy

  • ADHD is the only diagnosis where males are consistently better classified than females across all assessments
plt.clf()
vis.plotting_style()
x_pos = -0.1
y_pos = 1.1
labelsize = 40

fig = plt.figure()
gs = GridSpec(2, 2, figure=fig)

# A
ax = fig.add_subplot(gs[0,0])
df1 = df_all[
    (df_all['participant_group'].str.contains('Depression-')) & 
    (df_all['target']=='DX_01_Cat_new_binarize') &
    (df_all['data']=='data') 
    ]
ax = sns.violinplot(x='features', y='roc_auc_score', hue='participant_group', split=True, data=df1, ax=ax)
plt.xticks(rotation=45, ha='right')
ax.set_xlabel('')
ax.set_ylabel('')
#ax.set_title('')
plt.axhline(y=0.5, color='k', linestyle='--')
ax.text(x_pos, y_pos, 'A', transform=ax.transAxes, fontsize=labelsize, verticalalignment='top')
ax.set_ylim([0.3, 1])
ax.legend_.set_title(None)

# B
ax = fig.add_subplot(gs[0,1])
df1 = df_all[
    (df_all['participant_group'].str.contains('Anxiety-')) & 
    (df_all['target']=='DX_01_Cat_new_binarize') &
    (df_all['data']=='data') 
    ]
ax = sns.violinplot(x='features', y='roc_auc_score', hue='participant_group', split=True, data=df1, ax=ax)
plt.xticks(rotation=45, ha='right')
ax.set_xlabel('')
ax.set_ylabel('')
#ax.set_title('')
plt.axhline(y=0.5, color='k', linestyle='--')
ax.text(x_pos, y_pos, 'B', transform=ax.transAxes, fontsize=labelsize, verticalalignment='top')
ax.legend_.set_title(None)
ax.set_ylim([0.3, 1])

# C
ax = fig.add_subplot(gs[1,0])
df1 = df_all[
    (df_all['participant_group'].str.contains('Reading Impairment-')) & 
    (df_all['target']=='DX_01_Cat_new_binarize') &
    (df_all['data']=='data') 
    ]
ax = sns.violinplot(x='features', y='roc_auc_score', hue='participant_group', split=True, data=df1, ax=ax)
plt.xticks(rotation=45, ha='right')
ax.set_xlabel('')
ax.set_ylabel('')
#ax.set_title('')
plt.axhline(y=0.5, color='k', linestyle='--')
ax.text(x_pos, y_pos, 'B', transform=ax.transAxes, fontsize=labelsize, verticalalignment='top')
ax.legend_.set_title(None)
ax.set_ylim([0.3, 1])

# D
ax = fig.add_subplot(gs[1,1])
df1 = df_all[
    (df_all['participant_group'].str.contains('ASD-')) & 
    (df_all['target']=='DX_01_Cat_new_binarize') &
    (df_all['data']=='data') 
    ]
ax = sns.violinplot(x='features', y='roc_auc_score', hue='participant_group', split=True, data=df1, ax=ax)
plt.xticks(rotation=45, ha='right')
ax.set_xlabel('')
ax.set_ylabel('')
#ax.set_title('')
plt.axhline(y=0.5, color='k', linestyle='--')
ax.text(x_pos, y_pos, 'B', transform=ax.transAxes, fontsize=labelsize, verticalalignment='top')
ax.legend_.set_title(None)
ax.set_ylim([0.3, 1])

plt.subplots_adjust(left=0.125, bottom=0.002, right=2.0, top=2.5, wspace=.2, hspace=.3)
<Figure size 1228.8x844.8 with 0 Axes>

Interpreting Model Features - UNDER CONSTRUCTION


models_dict = {
                'ADHD': 'all_feature_models/2023-03-17_16-20-51-94',
                'ASD-females': 'all_feature_models/2023-03-19_15-31-26-26S-7',
                'ASD-males': 'all_feature_models/2023-03-22_16-13-13-13S-76',
                'ADHD-females': 'all_feature_models/2023-03-19_15-30-41-41S-99',
                'ADHD-males': 'all_feature_models/2023-03-19_15-30-25-25S-53',
               'Depression-females': 'all_feature_models/2023-03-22_17-43-23-23S-41',
               'Depression-males': 'all_feature_models/2023-03-22_17-43-23-23S-13',
               'Anxiety-females': 'all_feature_models/2023-03-22_17-43-19-19S-66',
               'Anxiety-males': 'all_feature_models/2023-03-22_17-43-14-14S-30',
               'Reading Impairment-females': 'all_feature_models/2023-03-22_17-43-10-10S-35',
               'Reading Impairment-males': 'all_feature_models/2023-03-19_15-31-26-26S-7' 
              }

# loop over models
df_all = pd.DataFrame()
for key, value in models_dict.items():
    MODEL_DIR = os.path.join(Defaults.MODEL_DIR, value)
    
    try:
        df_feat = pd.read_csv(os.path.join(MODEL_DIR, 'classifier-feature_importance.csv'))
        df_feat['participant_group'] = key
    
        # do some remapping
        df_feat['features'] = df_feat['features'].map({'Child Measures-all': 'Child Measures',
                    'Parent Measures-all': 'Parent Measures',
                    'Teacher Measures-all': 'Teacher Measures',
                    'Parent Measures-Basic_Demos': 'Demographics'}
                   )
        df_all = pd.concat([df_all, df_feat])
    except:
        pass
# FUNCTIONS

def get_data(data_type='raw', diagnoses=['ADHD', 'No Diagnosis'], measures=['CBCL', 'YSR', 'TRF']):
    """ get data for all assessments, filter based on diagnosis and measures
    
    Args:
        data_type (str): 'raw' or 'preprocessed'. Default is 'raw'
        diagnoses (list of str or None): list of diagnoses
        measures (list of str): list of measures
    """
    from hbn.data import make_dataset
    from hbn.models import item_analysis
    
    assessments = ['Parent', 'Child', 'Teacher']
    
    df_all = pd.DataFrame()
    # loop over measures
    for measure in measures:
        # load data files (preprocessed)
        df_data, df_dict, df_diagnosis = item_analysis.load_data(assessments=assessments, data_type=data_type)

        # filter data based on measure
        cols_to_keep = df_data.columns[df_data.columns.str.contains(f'{measure}|Identifiers')]
        df1 = df_data[cols_to_keep]

        # filter data dictionary based on measure
        df2 = df_dict[df_dict['datadic']==measure]

        # merge diagnosis with data and filter based on diagnosis
        if diagnoses is not None:
            df_diagnosis = df_diagnosis[df_diagnosis['Diagnosis'].str.contains('|'.join(diagnoses))]
        df_data_dx = df_diagnosis[['Identifiers', 'Age', 'Sex', 'Diagnosis', 'Race', 'Ethnicity']].merge(df1, on=['Identifiers'])
        df_data_dx.columns = df_data_dx.columns.str.replace('_x', '_raw').str.replace('_y', '')

        df_data_dx['Age'] = df_data_dx['Age'].round()

        df_all = pd.concat([df_all, df_data_dx])

    return df_all

def hue_regplot(data, x, y, hue, palette=None, **kwargs):
    from matplotlib.cm import get_cmap
    
    regplots = []
    
    levels = data[hue].unique()
    
    if palette is None:
        default_colors = get_cmap('tab10')
        palette = {k: default_colors(i) for i, k in enumerate(levels)}
    
    for key in levels:
        regplots.append(
            sns.regplot(
                x=x,
                y=y,
                data=data[data[hue] == key],
                color=palette[key],
                label=key,
                **kwargs
            )
        )
    
    return regplots

# load data (raw data for Parent, Child, Teacher measures), filtered by measures
df = get_data(data_type='raw', 
              diagnoses=['ADHD', 'No Diagnosis'], 
              measures=['CBCL', 'YSR', 'TRF']
             )
# CBCL Scores
df1 = pd.melt(df, 
        id_vars=['Identifiers', 'Age', 'Sex', 'Diagnosis', 'Race', 'Ethnicity'], 
        value_vars=['CBCL,CBCL_Int', 'CBCL_Pre,CBCLPre_Int'], value_name='Internalizing'
       ).groupby(['Age', 'Sex', 'Diagnosis']).mean().reset_index()

df2 = pd.melt(df, 
        id_vars=['Identifiers', 'Age', 'Sex', 'Diagnosis', 'Race', 'Ethnicity'], 
        value_vars=['CBCL,CBCL_Ext', 'CBCL_Pre,CBCLPre_Ext'], value_name='Externalizing'
       ).groupby(['Age', 'Sex', 'Diagnosis']).mean().reset_index()

df_CBCL = df1.merge(df2, on=['Age', 'Sex', 'Diagnosis'])

# TRF Scores
df1 = pd.melt(df, 
        id_vars=['Identifiers', 'Age', 'Sex', 'Diagnosis', 'Race', 'Ethnicity'], 
        value_vars=['TRF_Pre,TRF_P_Int', 'TRF,TRF_Int'], value_name='Internalizing'
       ).groupby(['Age', 'Sex', 'Diagnosis']).mean().reset_index()

df2 = pd.melt(df, 
        id_vars=['Identifiers', 'Age', 'Sex', 'Diagnosis', 'Race', 'Ethnicity'], 
        value_vars=['TRF_Pre,TRF_P_Ext', 'TRF,TRF_Ext'], value_name='Externalizing'
       ).groupby(['Age', 'Sex', 'Diagnosis']).mean().reset_index()

df_TRF = df1.merge(df2, on=['Age', 'Sex', 'Diagnosis'])

# YSR Scores
df1 = df[['Identifiers', 'Age', 'Sex', 'Diagnosis', 'Race', 'Ethnicity', 'YSR,YSR_Ext']].rename(
    {'YSR,YSR_Ext': 'Externalizing'}, axis=1).groupby(
    ['Age', 'Sex', 'Diagnosis']).mean().reset_index()

df2 = df[['Identifiers', 'Age', 'Sex', 'Diagnosis', 'Race', 'Ethnicity', 'YSR,YSR_Int']].rename(
    {'YSR,YSR_Int': 'Internalizing'}, axis=1).groupby(
    ['Age', 'Sex', 'Diagnosis']).mean().reset_index()

df_YSR = df1.merge(df2, on=['Age', 'Sex', 'Diagnosis'])

Inspecting Externalizing and Internalizing Symptoms

  • There are reported differences in externalizing and internalizing symptoms for children with ADHD.
  • Here, we wanted to ask two questions:
      1. Are there differences in internalizing and externalizing symptoms when reported by parents, teachers, and children?
      1. Are there differences in both int. and ext. symptoms across males and females?
      1. How do int. and ext. symptoms in children with ADHD compare to children with no diagnosis?
      1. How do different ADHD subtypes differ for int. and ext. symptoms for males and females?
plt.clf()
vis.plotting_style()
x_pos = -0.1
y_pos = 1.1
labelsize = 40

fig = plt.figure()
gs = GridSpec(2, 3, figure=fig)

# A
ax = fig.add_subplot(gs[0,0])
ax = hue_regplot(data=df_CBCL[df_CBCL['Diagnosis'].str.contains('ADHD')], 
                 x='Age', 
                 y='Internalizing', 
                 hue='Sex', 
                 scatter=False,
                 ax=ax
                )
ax[0].legend(fontsize=20)
ax[0].set_xlabel('Age')
ax[0].set_ylabel('Internalizing')
#ax[0].set_title('Parent')
#ax[0].text(x_pos, y_pos, 'A', transform=ax[0].transAxes, fontsize=labelsize, verticalalignment='top')
ax[0].set_ylim([-1, 25])
ax[0].set_xlim([3, 22])

# B
ax = fig.add_subplot(gs[0,1])
ax = hue_regplot(data=df_CBCL[df_CBCL['Diagnosis'].str.contains('ADHD')], 
                 x='Age', 
                 y='Externalizing', 
                 hue='Sex',
                 scatter=False,
                 ax=ax
                )
#ax[0].legend(fontsize=20)
ax[0].set_xlabel('')
ax[0].set_ylabel('Externalizing')
#ax[0].set_title('Parent')
#ax[0].text(x_pos, y_pos, 'B', transform=ax[0].transAxes, fontsize=labelsize, verticalalignment='top')
ax[0].set_ylim([-1, 25])
ax[0].set_xlim([3, 22])

# C
ax = fig.add_subplot(gs[0,2])
ax = hue_regplot(data=df_TRF[df_TRF['Diagnosis'].str.contains('ADHD')], 
                 x='Age', 
                 y='Internalizing', 
                 hue='Sex', 
                 scatter=False,
                 ax=ax
                )
#ax[0].legend(fontsize=20)
ax[0].set_xlabel('')
ax[0].set_ylabel('')
ax[0].set_title('Teacher')
#ax[0].text(x_pos, y_pos, 'C', transform=ax[0].transAxes, fontsize=labelsize, verticalalignment='top')
ax[0].set_ylim([-1, 25])
ax[0].set_xlim([3, 22])

# D
ax = fig.add_subplot(gs[1,0])
ax = hue_regplot(data=df_YSR[df_YSR['Diagnosis'].str.contains('ADHD')], 
                 x='Age', 
                 y='Internalizing', 
                 hue='Sex', 
                 scatter=False,
                 ax=ax
                )
#ax[0].legend(fontsize=20)
ax[0].set_xlabel('Age')
ax[0].set_ylabel('Internalizing')
#ax[0].set_title('Parent')
#ax[0].text(x_pos, y_pos, 'D', transform=ax[0].transAxes, fontsize=labelsize, verticalalignment='top')
ax[0].set_ylim([-1, 25])
ax[0].set_xlim([3, 22])
ax[0].legend(fontsize=20)

# E
ax = fig.add_subplot(gs[1,1])
ax = hue_regplot(data=df_YSR[df_YSR['Diagnosis'].str.contains('ADHD')], 
                 x='Age', 
                 y='Externalizing', 
                 hue='Sex', 
                 scatter=False,
                 ax=ax
                )
#ax[0].legend(fontsize=20)
ax[0].set_xlabel('')
ax[0].set_ylabel('Externalizing')
#ax[0].set_title('Child')
#ax[0].text(x_pos, y_pos, 'E', transform=ax[0].transAxes, fontsize=labelsize, verticalalignment='top')
ax[0].set_ylim([-1, 25])
ax[0].set_xlim([3, 22])

# F
ax = fig.add_subplot(gs[1,2])
ax = hue_regplot(data=df_TRF[df_TRF['Diagnosis'].str.contains('ADHD')], 
                 x='Age', 
                 y='Externalizing', 
                 hue='Sex', 
                 scatter=False,
                 ax=ax
                )
#ax[0].legend(fontsize=20)
ax[0].set_xlabel('')
ax[0].set_ylabel('')
#ax[0].set_title('Teacher')
#ax[0].text(x_pos, y_pos, 'F', transform=ax[0].transAxes, fontsize=labelsize, verticalalignment='top')
ax[0].set_ylim([-1, 25])
ax[0].set_xlim([3, 22])

plt.subplots_adjust(left=0.125, bottom=0.002, right=2.0, top=2.5, wspace=.2, hspace=.3)
<Figure size 1280x880 with 0 Axes>

Figure 1. Male and Female participants with ADHD

plt.clf()
vis.plotting_style()
x_pos = -0.1
y_pos = 1.1
labelsize = 40

fig = plt.figure()
gs = GridSpec(2, 3, figure=fig)

# A
ax = fig.add_subplot(gs[0,0])
ax = hue_regplot(data=df_CBCL[df_CBCL['Diagnosis']=='No Diagnosis Given'], 
                 x='Age', 
                 y='Internalizing', 
                 hue='Sex', 
                 scatter=False,
                 ax=ax
                )
ax[0].legend(fontsize=20)
ax[0].set_xlabel('Age')
ax[0].set_ylabel('Internalizing')
ax[0].set_title('Parent')
ax[0].text(x_pos, y_pos, 'A', transform=ax[0].transAxes, fontsize=labelsize, verticalalignment='top')
ax[0].set_ylim([-1, 25])
ax[0].set_xlim([3, 22])

# B
ax = fig.add_subplot(gs[0,1])
ax = hue_regplot(data=df_YSR[df_YSR['Diagnosis']=='No Diagnosis Given'], 
                 x='Age', 
                 y='Internalizing', 
                 hue='Sex',
                 scatter=False,
                 ax=ax
                )
#ax[0].legend(fontsize=20)
ax[0].set_xlabel('')
ax[0].set_ylabel('')
ax[0].set_title('Child')
ax[0].text(x_pos, y_pos, 'B', transform=ax[0].transAxes, fontsize=labelsize, verticalalignment='top')
ax[0].set_ylim([-1, 25])
ax[0].set_xlim([3, 22])

# C
ax = fig.add_subplot(gs[0,2])
ax = hue_regplot(data=df_TRF[df_TRF['Diagnosis']=='No Diagnosis Given'], 
                 x='Age', 
                 y='Internalizing', 
                 hue='Sex', 
                 scatter=False,
                 ax=ax
                )
#ax[0].legend(fontsize=20)
ax[0].set_xlabel('')
ax[0].set_ylabel('')
ax[0].set_title('Teacher')
ax[0].text(x_pos, y_pos, 'C', transform=ax[0].transAxes, fontsize=labelsize, verticalalignment='top')
ax[0].set_ylim([-1, 25])
ax[0].set_xlim([3, 22])

# D
ax = fig.add_subplot(gs[1,0])
ax = hue_regplot(data=df_CBCL[df_CBCL['Diagnosis']=='No Diagnosis Given'], 
                 x='Age', 
                 y='Externalizing', 
                 hue='Sex', 
                 scatter=False,
                 ax=ax
                )
#ax[0].legend(fontsize=20)
ax[0].set_xlabel('Age')
ax[0].set_ylabel('Externalizing')
#ax[0].set_title('Parent')
ax[0].text(x_pos, y_pos, 'D', transform=ax[0].transAxes, fontsize=labelsize, verticalalignment='top')
ax[0].set_ylim([-1, 25])
ax[0].set_xlim([3, 22])

# E
ax = fig.add_subplot(gs[1,1])
ax = hue_regplot(data=df_YSR[df_YSR['Diagnosis']=='No Diagnosis Given'], 
                 x='Age', 
                 y='Externalizing', 
                 hue='Sex', 
                 scatter=False,
                 ax=ax
                )
#ax[0].legend(fontsize=20)
ax[0].set_xlabel('')
ax[0].set_ylabel('')
#ax[0].set_title('Child')
ax[0].text(x_pos, y_pos, 'E', transform=ax[0].transAxes, fontsize=labelsize, verticalalignment='top')
ax[0].set_ylim([-1, 25])
ax[0].set_xlim([3, 22])

# F
ax = fig.add_subplot(gs[1,2])
ax = hue_regplot(data=df_TRF[df_TRF['Diagnosis']=='No Diagnosis Given'], 
                 x='Age', 
                 y='Externalizing', 
                 hue='Sex', 
                 scatter=False,
                 ax=ax
                )
#ax[0].legend(fontsize=20)
ax[0].set_xlabel('')
ax[0].set_ylabel('')
#ax[0].set_title('Teacher')
ax[0].text(x_pos, y_pos, 'F', transform=ax[0].transAxes, fontsize=labelsize, verticalalignment='top')
ax[0].set_ylim([-1, 25])
ax[0].set_xlim([3, 22])

plt.subplots_adjust(left=0.125, bottom=0.002, right=2.0, top=2.5, wspace=.2, hspace=.3)
<Figure size 1280x880 with 0 Axes>

Figure 2. Male and Female participants with no diagnosis

plt.clf()
vis.plotting_style()
x_pos = -0.1
y_pos = 1.1
labelsize = 40

fig = plt.figure()
gs = GridSpec(2, 3, figure=fig)

# A
ax = fig.add_subplot(gs[0,0])
ax = hue_regplot(data=df_CBCL[(df_CBCL['Diagnosis'].str.contains('ADHD')) & 
                              (df_CBCL['Sex']=='female')], 
                 x='Age', 
                 y='Internalizing', 
                 hue='Diagnosis', 
                 scatter=False,
                 ax=ax
                )
ax[0].legend(fontsize=20)
ax[0].set_xlabel('Age')
ax[0].set_ylabel('Internalizing')
ax[0].set_title('Parent')
ax[0].text(x_pos, y_pos, 'A', transform=ax[0].transAxes, fontsize=labelsize, verticalalignment='top')
ax[0].set_ylim([-1, 25])
ax[0].set_xlim([3, 22])

# B
ax = fig.add_subplot(gs[0,1])
ax = hue_regplot(data=df_YSR[(df_YSR['Diagnosis'].str.contains('ADHD')) & 
                              (df_CBCL['Sex']=='female')], 
                 x='Age', 
                 y='Internalizing', 
                 hue='Diagnosis',
                 scatter=False,
                 ax=ax
                )
#ax[0].legend(fontsize=20)
ax[0].set_xlabel('')
ax[0].set_ylabel('')
ax[0].set_title('Child')
ax[0].text(x_pos, y_pos, 'B', transform=ax[0].transAxes, fontsize=labelsize, verticalalignment='top')
ax[0].set_ylim([-1, 25])
ax[0].set_xlim([3, 22])

# C
ax = fig.add_subplot(gs[0,2])
ax = hue_regplot(data=df_TRF[(df_TRF['Diagnosis'].str.contains('ADHD')) &
                              (df_CBCL['Sex']=='female')], 
                 x='Age', 
                 y='Internalizing', 
                 hue='Diagnosis', 
                 scatter=False,
                 ax=ax
                )
#ax[0].legend(fontsize=20)
ax[0].set_xlabel('')
ax[0].set_ylabel('')
ax[0].set_title('Teacher')
ax[0].text(x_pos, y_pos, 'C', transform=ax[0].transAxes, fontsize=labelsize, verticalalignment='top')
ax[0].set_ylim([-1, 25])
ax[0].set_xlim([3, 22])

# D
ax = fig.add_subplot(gs[1,0])
ax = hue_regplot(data=df_CBCL[df_CBCL['Diagnosis'].str.contains('ADHD') & 
                              (df_CBCL['Sex']=='female')], 
                 x='Age', 
                 y='Externalizing', 
                 hue='Diagnosis', 
                 scatter=False,
                 ax=ax
                )
#ax[0].legend(fontsize=20)
ax[0].set_xlabel('Age')
ax[0].set_ylabel('Externalizing')
#ax[0].set_title('Parent')
ax[0].text(x_pos, y_pos, 'D', transform=ax[0].transAxes, fontsize=labelsize, verticalalignment='top')
ax[0].set_ylim([-1, 25])
ax[0].set_xlim([3, 22])

# E
ax = fig.add_subplot(gs[1,1])
ax = hue_regplot(data=df_YSR[df_YSR['Diagnosis'].str.contains('ADHD') & 
                              (df_CBCL['Sex']=='female')], 
                 x='Age', 
                 y='Externalizing', 
                 hue='Diagnosis', 
                 scatter=False,
                 ax=ax
                )
#ax[0].legend(fontsize=20)
ax[0].set_xlabel('')
ax[0].set_ylabel('')
#ax[0].set_title('Child')
ax[0].text(x_pos, y_pos, 'E', transform=ax[0].transAxes, fontsize=labelsize, verticalalignment='top')
ax[0].set_ylim([-1, 25])
ax[0].set_xlim([3, 22])

# F
ax = fig.add_subplot(gs[1,2])
ax = hue_regplot(data=df_TRF[df_TRF['Diagnosis'].str.contains('ADHD') & 
                              (df_CBCL['Sex']=='female')], 
                 x='Age', 
                 y='Externalizing', 
                 hue='Diagnosis', 
                 scatter=False,
                 ax=ax
                )
#ax[0].legend(fontsize=20)
ax[0].set_xlabel('')
ax[0].set_ylabel('')
#ax[0].set_title('Teacher')
ax[0].text(x_pos, y_pos, 'F', transform=ax[0].transAxes, fontsize=labelsize, verticalalignment='top')
ax[0].set_ylim([-1, 25])
ax[0].set_xlim([3, 22])

plt.subplots_adjust(left=0.125, bottom=0.002, right=2.0, top=2.5, wspace=.2, hspace=.3)
<Figure size 1280x880 with 0 Axes>

Figure 3. Female participants with ADHD

plt.clf()
vis.plotting_style()
x_pos = -0.1
y_pos = 1.1
labelsize = 40

fig = plt.figure()
gs = GridSpec(2, 3, figure=fig)

# A
ax = fig.add_subplot(gs[0,0])
ax = hue_regplot(data=df_CBCL[(df_CBCL['Diagnosis'].str.contains('ADHD')) & 
                              (df_CBCL['Sex']=='male')], 
                 x='Age', 
                 y='Internalizing', 
                 hue='Diagnosis', 
                 scatter=False,
                 ax=ax
                )
ax[0].legend(fontsize=20)
ax[0].set_xlabel('Age')
ax[0].set_ylabel('Internalizing')
ax[0].set_title('Parent')
ax[0].text(x_pos, y_pos, 'A', transform=ax[0].transAxes, fontsize=labelsize, verticalalignment='top')
ax[0].set_ylim([-1, 25])
ax[0].set_xlim([3, 22])

# B
ax = fig.add_subplot(gs[0,1])
ax = hue_regplot(data=df_YSR[(df_YSR['Diagnosis'].str.contains('ADHD')) & 
                              (df_CBCL['Sex']=='male')], 
                 x='Age', 
                 y='Internalizing', 
                 hue='Diagnosis',
                 scatter=False,
                 ax=ax
                )
#ax[0].legend(fontsize=20)
ax[0].set_xlabel('')
ax[0].set_ylabel('')
ax[0].set_title('Child')
ax[0].text(x_pos, y_pos, 'B', transform=ax[0].transAxes, fontsize=labelsize, verticalalignment='top')
ax[0].set_ylim([-1, 25])
ax[0].set_xlim([3, 22])

# C
ax = fig.add_subplot(gs[0,2])
ax = hue_regplot(data=df_TRF[(df_TRF['Diagnosis'].str.contains('ADHD')) &
                              (df_CBCL['Sex']=='male')], 
                 x='Age', 
                 y='Internalizing', 
                 hue='Diagnosis', 
                 scatter=False,
                 ax=ax
                )
#ax[0].legend(fontsize=20)
ax[0].set_xlabel('')
ax[0].set_ylabel('')
ax[0].set_title('Teacher')
ax[0].text(x_pos, y_pos, 'C', transform=ax[0].transAxes, fontsize=labelsize, verticalalignment='top')
ax[0].set_ylim([-1, 25])
ax[0].set_xlim([3, 22])

# D
ax = fig.add_subplot(gs[1,0])
ax = hue_regplot(data=df_CBCL[df_CBCL['Diagnosis'].str.contains('ADHD') & 
                              (df_CBCL['Sex']=='male')], 
                 x='Age', 
                 y='Externalizing', 
                 hue='Diagnosis', 
                 scatter=False,
                 ax=ax
                )
#ax[0].legend(fontsize=20)
ax[0].set_xlabel('Age')
ax[0].set_ylabel('Externalizing')
#ax[0].set_title('Parent')
ax[0].text(x_pos, y_pos, 'D', transform=ax[0].transAxes, fontsize=labelsize, verticalalignment='top')
ax[0].set_ylim([-1, 25])
ax[0].set_xlim([3, 22])

# E
ax = fig.add_subplot(gs[1,1])
ax = hue_regplot(data=df_YSR[df_YSR['Diagnosis'].str.contains('ADHD') & 
                              (df_CBCL['Sex']=='male')], 
                 x='Age', 
                 y='Externalizing', 
                 hue='Diagnosis', 
                 scatter=False,
                 ax=ax
                )
#ax[0].legend(fontsize=20)
ax[0].set_xlabel('')
ax[0].set_ylabel('')
#ax[0].set_title('Child')
ax[0].text(x_pos, y_pos, 'E', transform=ax[0].transAxes, fontsize=labelsize, verticalalignment='top')
ax[0].set_ylim([-1, 25])
ax[0].set_xlim([3, 22])

# F
ax = fig.add_subplot(gs[1,2])
ax = hue_regplot(data=df_TRF[df_TRF['Diagnosis'].str.contains('ADHD') & 
                              (df_CBCL['Sex']=='male')], 
                 x='Age', 
                 y='Externalizing', 
                 hue='Diagnosis', 
                 scatter=False,
                 ax=ax
                )
#ax[0].legend(fontsize=20)
ax[0].set_xlabel('')
ax[0].set_ylabel('')
#ax[0].set_title('Teacher')
ax[0].text(x_pos, y_pos, 'F', transform=ax[0].transAxes, fontsize=labelsize, verticalalignment='top')
ax[0].set_ylim([-1, 25])
ax[0].set_xlim([3, 22])

plt.subplots_adjust(left=0.125, bottom=0.002, right=2.0, top=2.5, wspace=.2, hspace=.3)
<Figure size 1280x880 with 0 Axes>

Figure 4. Male participants with ADHD